
- Start >
- Rivers >
- Discharge >
- Naab - Regen >
- Warnbach >
- Chart of year

Chart of year Warnbach / Schwarzach
Discharge from 01.01.2024 to 31.12.2024
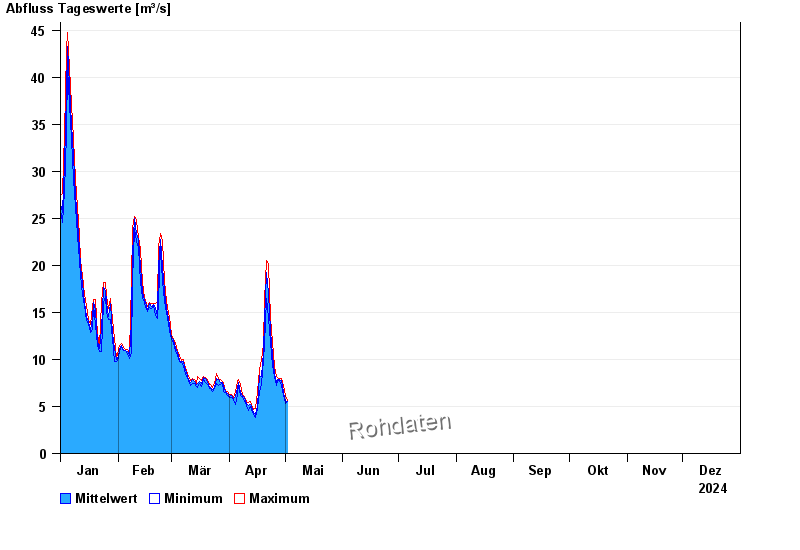
| Date | Mean value [m³/s] | Maximum [m³/s] | Minimum [m³/s] |
|---|---|---|---|
| 07.05.2024 | 4.53 | 4.76 | 4.21 |
| 06.05.2024 | 4.2 | 4.32 | 4.1 |
| 05.05.2024 | 4.31 | 4.44 | 4.21 |
| 04.05.2024 | 4.35 | 4.54 | 4.21 |
| 03.05.2024 | 4.43 | 4.54 | 4.32 |
| 02.05.2024 | 5.39 | 5.64 | 4.65 |
| 01.05.2024 | 5.5 | 6.19 | 5.3 |
© Bayerisches Landesamt für Umwelt 2024