
- Start >
- Rivers >
- Discharge >
- Naab - Regen >
- Warnbach >
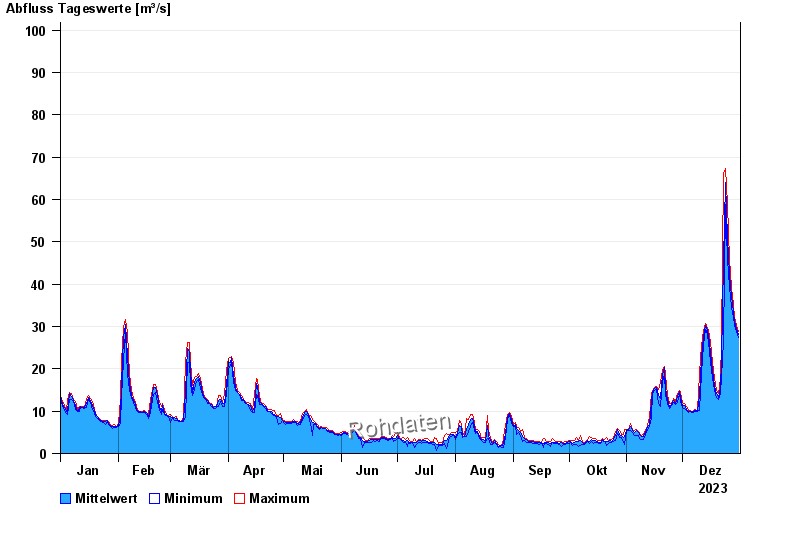
- Chart of year

Chart of year Warnbach / Schwarzach
Discharge from 01.01.2023 to 31.12.2023
- 09.07.1954 Abfluss: 145 m³/s
- 29.12.1947 Abfluss: 132 m³/s
- 23.02.1970 Abfluss: 125 m³/s
- 12.07.1948 Abfluss: 117 m³/s
- 15.03.1947 Abfluss: 112 m³/s
| Date | Mean value [m³/s] | Maximum [m³/s] | Minimum [m³/s] |
|---|---|---|---|
| 31.12.2023 | 28 | 28.9 | 27.4 |
| 30.12.2023 | 29.6 | 30.3 | 28.9 |
| 29.12.2023 | 31.2 | 32.1 | 30.3 |
| 28.12.2023 | 33.4 | 35.1 | 32.1 |
| 27.12.2023 | 37 | 39.3 | 34.5 |
| 26.12.2023 | 42.4 | 45.8 | 39.3 |
| 25.12.2023 | 51 | 58.8 | 45.8 |
© Bayerisches Landesamt für Umwelt 2024