
- Start >
- Rivers >
- Discharge >
- Naab - Regen >
- Vilseck >
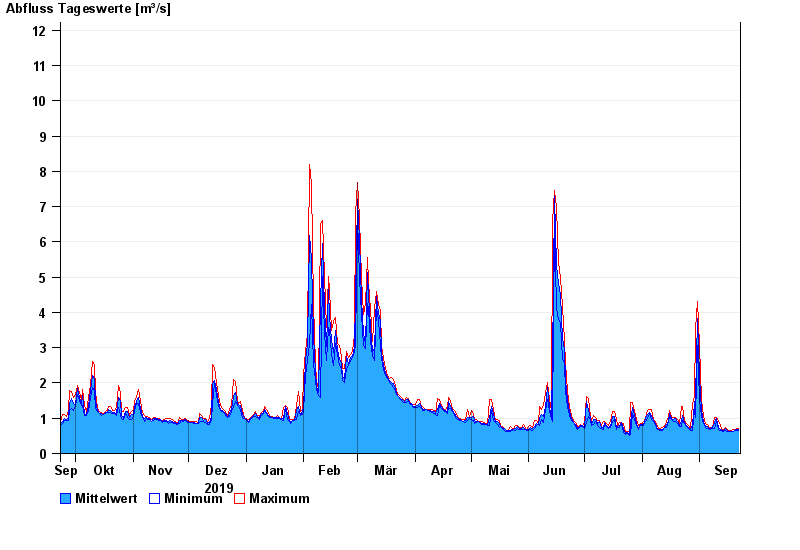
- Chart of year

Chart of year Vilseck / Vils
Discharge from 23.09.2019 to 22.09.2020
- 23.02.1970 Abfluss: 53 m³/s
- 26.01.1995 Abfluss: 40,9 m³/s
- 21.12.1993 Abfluss: 37,8 m³/s
- 03.01.2003 Abfluss: 35,8 m³/s
- 29.10.1998 Abfluss: 32,3 m³/s
| Date | Mean value [m³/s] | Maximum [m³/s] | Minimum [m³/s] |
|---|---|---|---|
| 22.09.2020 | 0.672 | 0.706 | 0.662 |
| 21.09.2020 | 0.674 | 0.706 | 0.656 |
| 20.09.2020 | 0.668 | 0.676 | 0.65 |
| 19.09.2020 | 0.633 | 0.67 | 0.621 |
| 18.09.2020 | 0.632 | 0.642 | 0.617 |
| 17.09.2020 | 0.634 | 0.652 | 0.63 |
| 16.09.2020 | 0.639 | 0.673 | 0.625 |
© Bayerisches Landesamt für Umwelt 2024