
- Start >
- Rivers >
- Discharge >
- Naab - Regen >
- Vilseck >
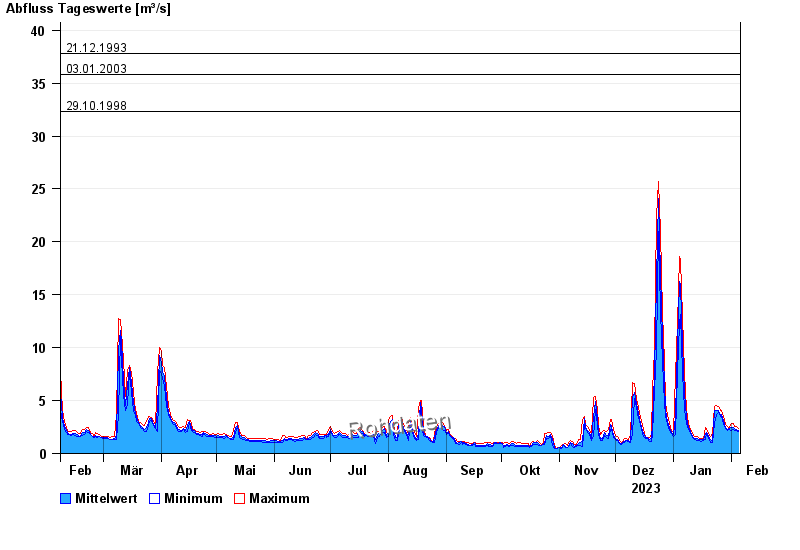
- Chart of year

Chart of year Vilseck / Vils
Discharge from 06.02.2023 to 05.02.2024
- 23.02.1970 Abfluss: 53 m³/s
- 26.01.1995 Abfluss: 40,9 m³/s
- 21.12.1993 Abfluss: 37,8 m³/s
- 03.01.2003 Abfluss: 35,8 m³/s
- 29.10.1998 Abfluss: 32,3 m³/s
| Date | Mean value [m³/s] | Maximum [m³/s] | Minimum [m³/s] |
|---|---|---|---|
| 05.02.2024 | 2.19 | 2.34 | 2.06 |
| 04.02.2024 | 2.28 | 2.57 | 2.13 |
| 03.02.2024 | 2.32 | 2.57 | 2.2 |
| 02.02.2024 | 2.47 | 2.8 | 2.27 |
| 01.02.2024 | 2.5 | 2.88 | 2.2 |
| 31.01.2024 | 2.34 | 2.49 | 2.27 |
| 30.01.2024 | 2.27 | 2.57 | 2.13 |
© Bayerisches Landesamt für Umwelt 2024