
- Start >
- Rivers >
- Discharge >
- Naab - Regen >
- Viechtach Reibenmühle >
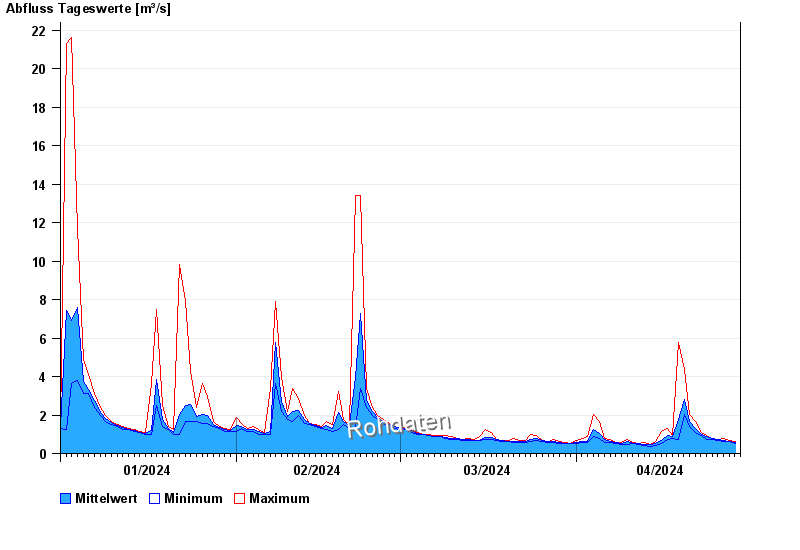
- Chart of year

Chart of year Viechtach Reibenmühle / Aitnach
Discharge from 01.01.2024 to 29.04.2024
| Date | Mean value [m³/s] | Maximum [m³/s] | Minimum [m³/s] |
|---|---|---|---|
| 29.04.2024 | 0.592 | 0.616 | 0.513 |
| 28.04.2024 | 0.638 | 0.673 | 0.616 |
| 27.04.2024 | 0.674 | 0.795 | 0.616 |
| 26.04.2024 | 0.718 | 0.731 | 0.673 |
| 25.04.2024 | 0.788 | 0.795 | 0.731 |
| 24.04.2024 | 0.876 | 0.934 | 0.731 |
| 23.04.2024 | 1.01 | 1.08 | 0.934 |
© Bayerisches Landesamt für Umwelt 2024