
- Start >
- Rivers >
- Discharge >
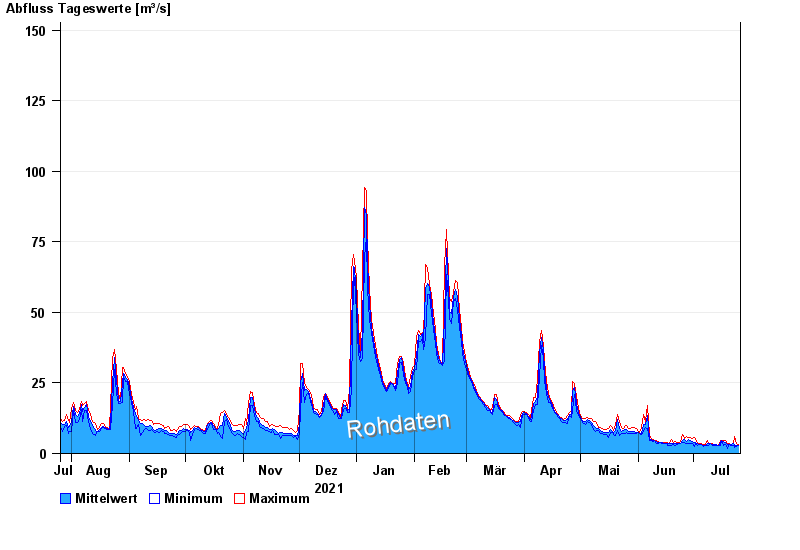
- Naab - Regen >
- Unterköblitz >
- Chart of year

Chart of year Unterköblitz / Naab
Discharge from 26.07.2021 to 25.07.2022
- 11.07.1954 Abfluss: 351 m³/s
- 27.01.1995 Abfluss: 351 m³/s
- 03.01.2003 Abfluss: 328 m³/s
- 29.12.1947 Abfluss: 320 m³/s
- 07.02.1980 Abfluss: 298 m³/s
| Date | Mean value [m³/s] | Maximum [m³/s] | Minimum [m³/s] |
|---|---|---|---|
| 25.07.2022 | 2.89 | 3.22 | 2.8 |
| 24.07.2022 | 2.98 | 3.45 | 2.6 |
| 23.07.2022 | 2.95 | 6.08 | 2.06 |
| 22.07.2022 | 3.46 | 3.68 | 3 |
| 21.07.2022 | 3.11 | 3.22 | 3 |
| 20.07.2022 | 3.26 | 3.45 | 3.22 |
| 19.07.2022 | 3.03 | 3.45 | 1.62 |
© Bayerisches Landesamt für Umwelt 2024