
- Start >
- Rivers >
- Discharge >
- Naab - Regen >
- Unterköblitz >
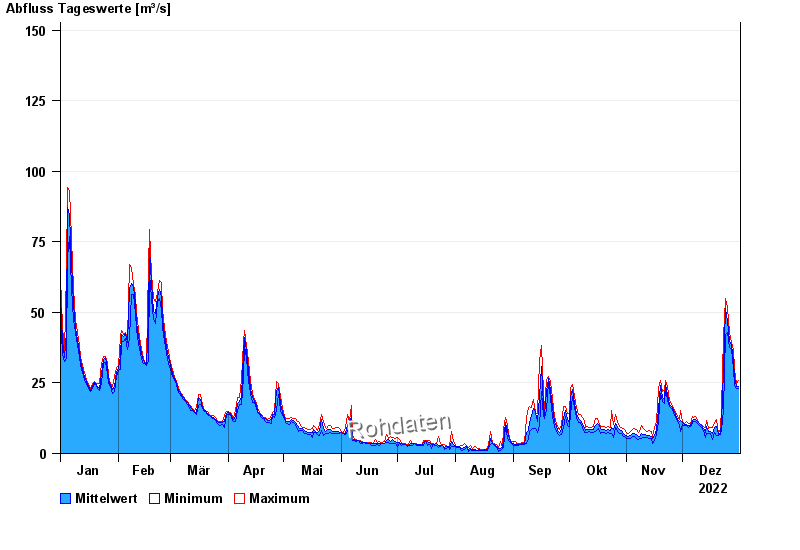
- Chart of year

Chart of year Unterköblitz / Naab
Discharge from 01.01.2022 to 31.12.2022
- 11.07.1954 Abfluss: 351 m³/s
- 27.01.1995 Abfluss: 351 m³/s
- 03.01.2003 Abfluss: 328 m³/s
- 29.12.1947 Abfluss: 320 m³/s
- 07.02.1980 Abfluss: 298 m³/s
| Date | Mean value [m³/s] | Maximum [m³/s] | Minimum [m³/s] |
|---|---|---|---|
| 31.12.2022 | 23.8 | 26 | 23 |
| 30.12.2022 | 23.7 | 24.8 | 23 |
| 29.12.2022 | 27 | 29.8 | 24.2 |
| 28.12.2022 | 32.9 | 36.8 | 29.8 |
| 27.12.2022 | 38.4 | 39.5 | 36.8 |
| 26.12.2022 | 39.7 | 42.8 | 37.5 |
| 25.12.2022 | 46.7 | 51.6 | 42.8 |
© Bayerisches Landesamt für Umwelt 2024