
- Start >
- Rivers >
- Discharge >
- Naab - Regen >
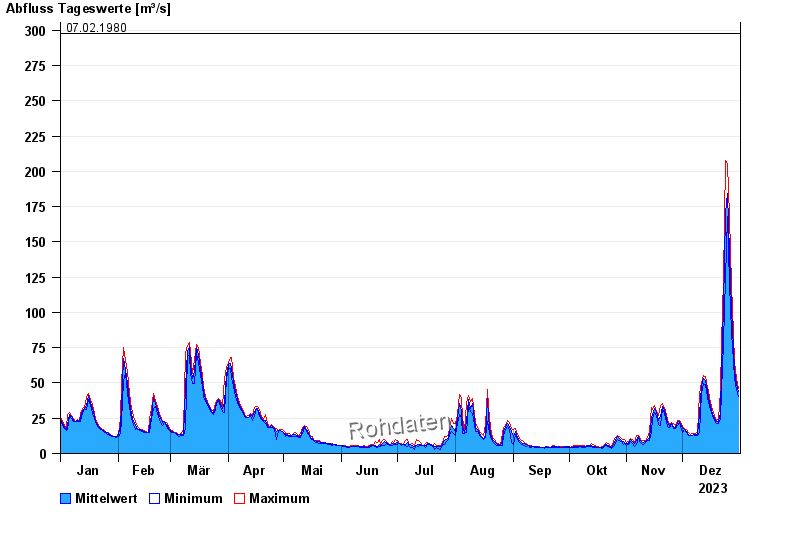
- Unterköblitz >
- Chart of year

Chart of year Unterköblitz / Naab
Discharge from 01.01.2023 to 31.12.2023
- 11.07.1954 Abfluss: 351 m³/s
- 27.01.1995 Abfluss: 351 m³/s
- 03.01.2003 Abfluss: 328 m³/s
- 29.12.1947 Abfluss: 320 m³/s
- 07.02.1980 Abfluss: 298 m³/s
| Date | Mean value [m³/s] | Maximum [m³/s] | Minimum [m³/s] |
|---|---|---|---|
| 31.12.2023 | 43.6 | 46.4 | 40.3 |
| 30.12.2023 | 48.6 | 53.4 | 45.7 |
| 29.12.2023 | 58.6 | 64.8 | 53.4 |
| 28.12.2023 | 74.2 | 84.8 | 65.5 |
| 27.12.2023 | 102 | 119 | 85.6 |
| 26.12.2023 | 142 | 168 | 120 |
| 25.12.2023 | 184 | 205 | 168 |
© Bayerisches Landesamt für Umwelt 2024