
- Start >
- Rivers >
- Discharge >
- Naab - Regen >
- Unterköblitz >
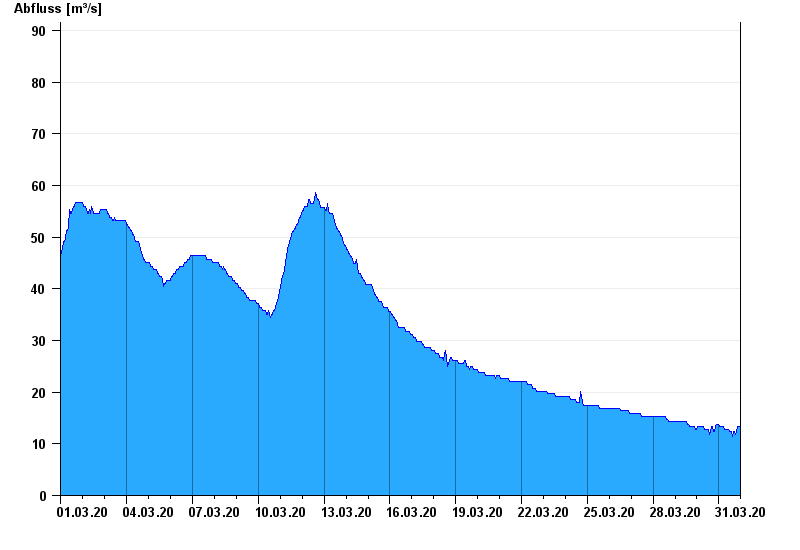
- Chart of month

Chart of month Unterköblitz / Naab
Discharge from 01.03.2020 to 31.03.2020
- 11.07.1954 Abfluss: 351 m³/s
- 27.01.1995 Abfluss: 351 m³/s
- 03.01.2003 Abfluss: 328 m³/s
- 29.12.1947 Abfluss: 320 m³/s
- 07.02.1980 Abfluss: 298 m³/s
| Date | Runoff [m³/s] |
|---|---|
| 01.04.2020 00:45 | 13.4 |
| 01.04.2020 00:30 | 13.4 |
| 01.04.2020 00:15 | 13.4 |
| 01.04.2020 00:00 | 13.4 |
| 31.03.2020 23:45 | 13.4 |
| 31.03.2020 23:30 | 13.4 |
| 31.03.2020 23:15 | 13.4 |
© Bayerisches Landesamt für Umwelt 2024