
- Start >
- Rivers >
- Discharge >
- Naab - Regen >
- Unterköblitz >
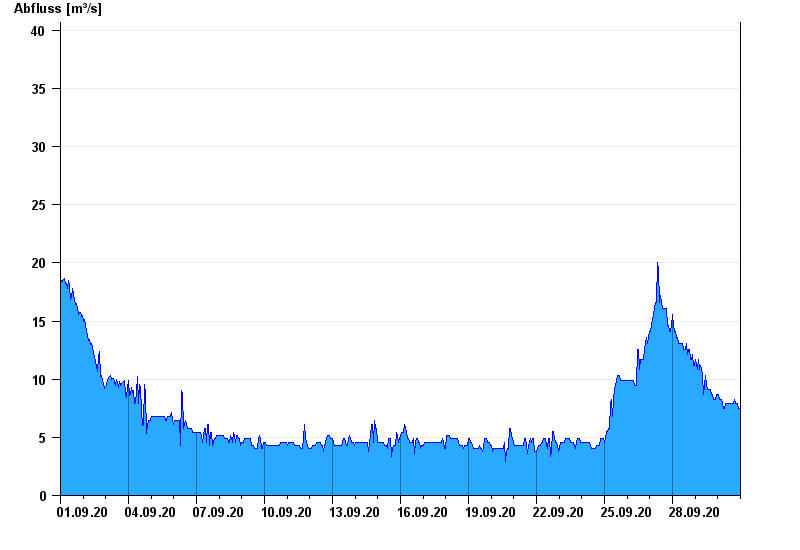
- Chart of month

Chart of month Unterköblitz / Naab
Discharge from 01.09.2020 to 30.09.2020
- HQ1 125 m³/s
- HQ2 170 m³/s
- HQ5 225 m³/s
- HQ10 270 m³/s
- HQ20 315 m³/s
- HQ50 375 m³/s
- HQ100 420 m³/s
| Date | Runoff [m³/s] |
|---|---|
| 01.10.2020 00:45 | 7.89 |
| 01.10.2020 00:30 | 7.51 |
| 01.10.2020 00:15 | 7.51 |
| 01.10.2020 00:00 | 7.51 |
| 30.09.2020 23:45 | 7.51 |
| 30.09.2020 23:30 | 7.51 |
| 30.09.2020 23:15 | 7.51 |
© Bayerisches Landesamt für Umwelt 2024