
- Start >
- Rivers >
- Discharge >
- Naab - Regen >
- Unterbruck Flutmulde >
- Chart of year

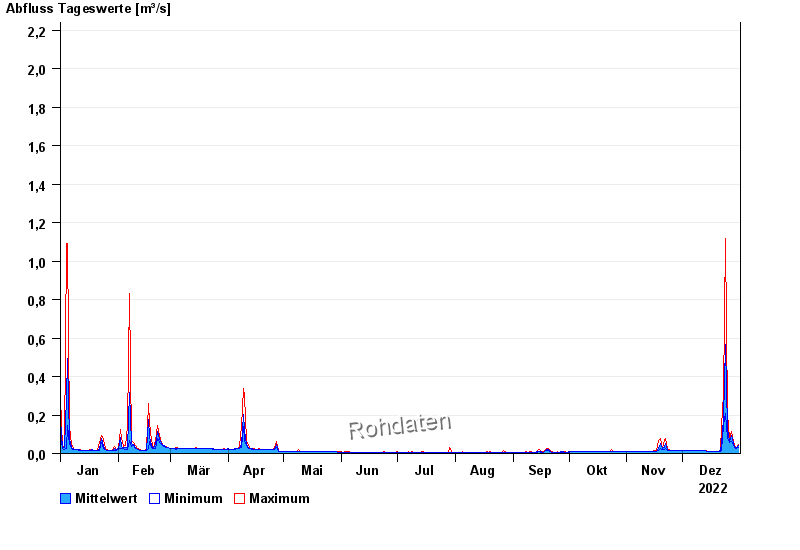
Chart of year Unterbruck Flutmulde / Haidenaab
Discharge from 01.01.2022 to 31.12.2022
 Für diesen Pegel sind keine Jährlichkeiten hinterlegt.
| Date | Mean value [m³/s] | Maximum [m³/s] | Minimum [m³/s] |
|---|---|---|---|
| 31.12.2022 | 0.042 | 0.049 | 0.032 |
| 30.12.2022 | 0.031 | 0.033 | 0.028 |
| 29.12.2022 | 0.037 | 0.044 | 0.029 |
| 28.12.2022 | 0.051 | 0.062 | 0.044 |
| 27.12.2022 | 0.091 | 0.114 | 0.062 |
| 26.12.2022 | 0.065 | 0.077 | 0.057 |
| 25.12.2022 | 0.125 | 0.209 | 0.077 |
© Bayerisches Landesamt für Umwelt 2024