
- Start >
- Rivers >
- Discharge >
- Naab - Regen >
- Unterbruck Flutmulde >
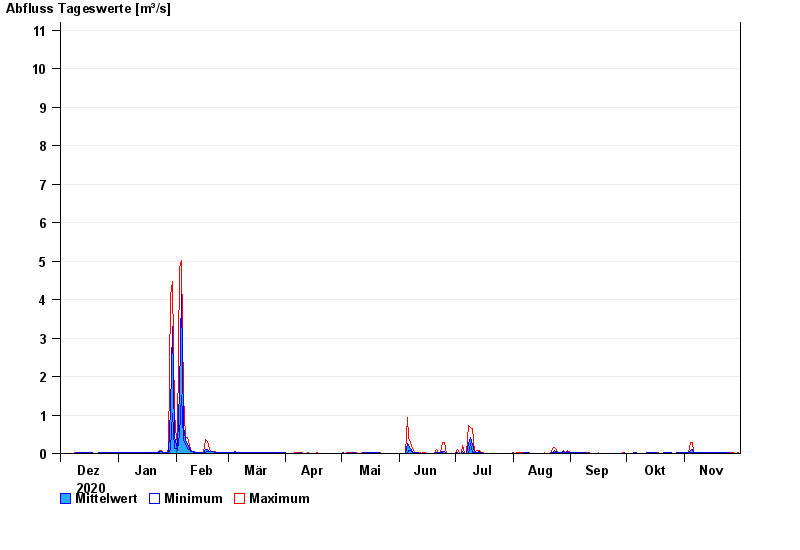
- Chart of year

Chart of year Unterbruck Flutmulde / Haidenaab
Discharge from 01.12.2020 to 30.11.2021
 Für diesen Pegel sind keine Jährlichkeiten hinterlegt.
| Date | Mean value [m³/s] | Maximum [m³/s] | Minimum [m³/s] |
|---|---|---|---|
| 30.11.2021 | 0.011 | 0.013 | 0.011 |
| 29.11.2021 | 0.011 | 0.011 | 0.01 |
| 28.11.2021 | 0.011 | 0.012 | 0.011 |
| 27.11.2021 | 0.012 | 0.013 | 0.012 |
| 26.11.2021 | 0.012 | 0.013 | 0.012 |
| 25.11.2021 | 0.013 | 0.013 | 0.012 |
| 24.11.2021 | 0.013 | 0.014 | 0.013 |
© Bayerisches Landesamt für Umwelt 2024