
- Start >
- Rivers >
- Discharge >
- Naab - Regen >
- Unterbruck Flutmulde >
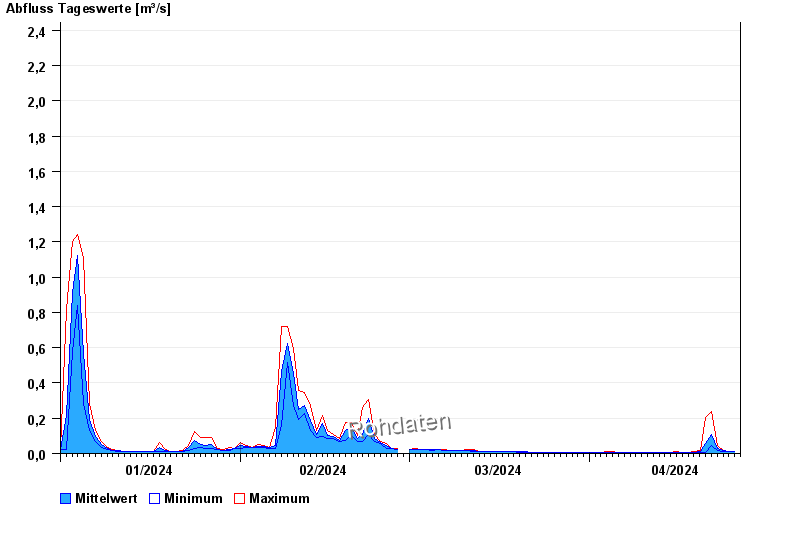
- Chart of year

Chart of year Unterbruck Flutmulde / Haidenaab
Discharge from 01.01.2024 to 26.04.2024
 Für diesen Pegel sind keine Jährlichkeiten hinterlegt.
| Date | Mean value [m³/s] | Maximum [m³/s] | Minimum [m³/s] |
|---|---|---|---|
| 26.04.2024 | 0.01 | 0.011 | 0.009 |
| 25.04.2024 | 0.011 | 0.012 | 0.011 |
| 24.04.2024 | 0.014 | 0.017 | 0.012 |
| 23.04.2024 | 0.026 | 0.046 | 0.017 |
| 22.04.2024 | 0.105 | 0.236 | 0.043 |
| 21.04.2024 | 0.059 | 0.205 | 0.008 |
| 20.04.2024 | 0.011 | 0.015 | 0.008 |
© Bayerisches Landesamt für Umwelt 2024