
- Start >
- Rivers >
- Discharge >
- Naab - Regen >
- Unterbruck >
- Chart of year

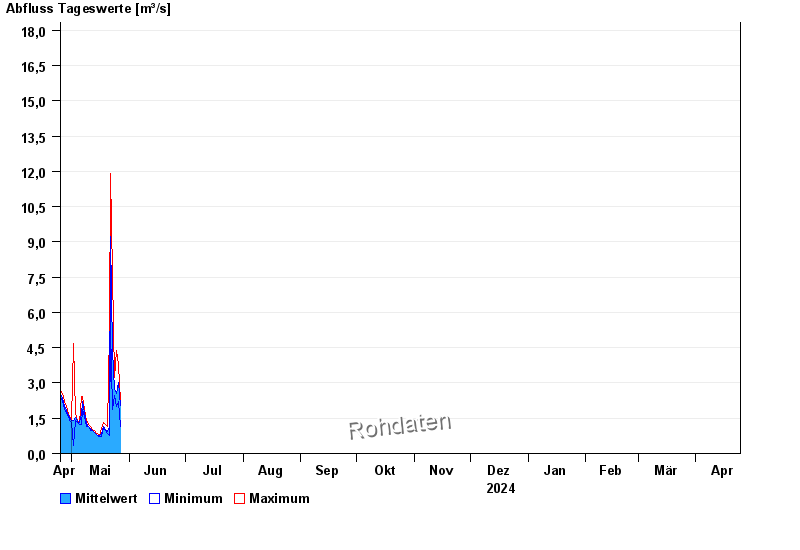
Chart of year Unterbruck / Haidenaab
Discharge from 25.04.2024 to 24.04.2025
- 28.05.2006 Abfluss: 50,3 m³/s
- 13.02.2005 Abfluss: 49,5 m³/s
- 14.01.2011 Abfluss: 48,5 m³/s
- 06.01.1982 Abfluss: 46,6 m³/s
- 23.12.2012 Abfluss: 46,1 m³/s
| Date | Mean value [m³/s] | Maximum [m³/s] | Minimum [m³/s] |
|---|---|---|---|
| 06.05.2024 | 1.28 | 1.4 | 1.23 |
| 05.05.2024 | 1.3 | 1.31 | 1.23 |
| 04.05.2024 | 1.36 | 1.4 | 1.31 |
| 03.05.2024 | 1.54 | 1.68 | 1.4 |
| 02.05.2024 | 1.42 | 4.66 | 0.353 |
| 01.05.2024 | 1.39 | 1.4 | 1.31 |
| 30.04.2024 | 1.55 | 1.58 | 1.4 |
© Bayerisches Landesamt für Umwelt 2024