
- Start >
- Rivers >
- Discharge >
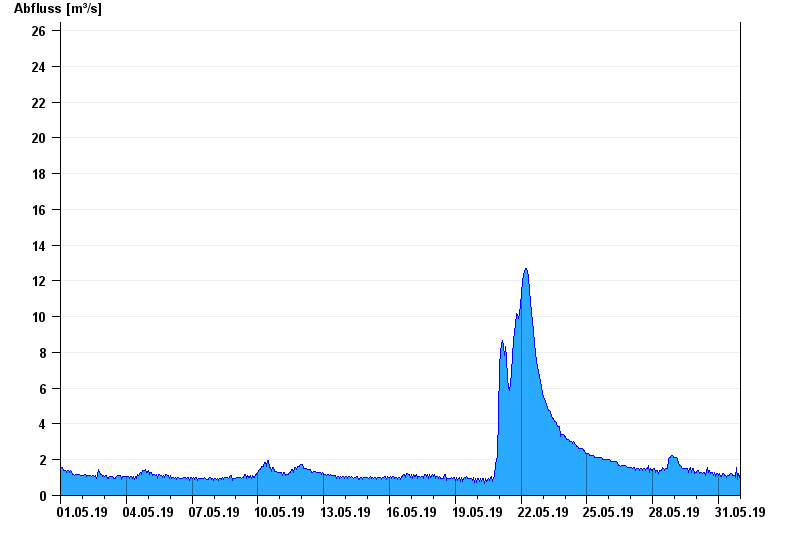
- Naab - Regen >
- Unterbruck >
- Chart of month

Chart of month Unterbruck / Haidenaab
Discharge from 01.05.2019 to 31.05.2019
- HQ1 30,7 m³/s
- HQ2 37,3 m³/s
- HQ5 45 m³/s
- HQ10 55 m³/s
- HQ20 68 m³/s
- HQ50 83 m³/s
- HQ100 95 m³/s
| Date | Runoff [m³/s] |
|---|---|
| 01.06.2019 00:45 | 1.14 |
| 01.06.2019 00:30 | 1.14 |
| 01.06.2019 00:15 | 1.14 |
| 01.06.2019 00:00 | 1.14 |
| 31.05.2019 23:45 | 1.06 |
| 31.05.2019 23:30 | 0.98 |
| 31.05.2019 23:15 | 0.908 |
© Bayerisches Landesamt für Umwelt 2024