
- Start >
- Rivers >
- Discharge >
- Naab - Regen >
- Trausnitz u. d. Mühle >
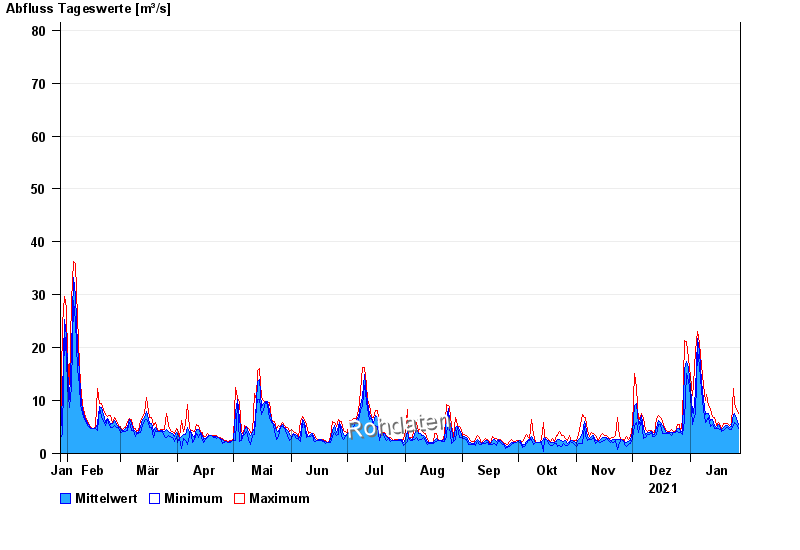
- Chart of year

Chart of year Trausnitz u. d. Mühle / Pfreimd
Discharge from 28.01.2021 to 27.01.2022
 Für diesen Pegel sind keine Jährlichkeiten hinterlegt.
| Date | Mean value [m³/s] | Maximum [m³/s] | Minimum [m³/s] |
|---|---|---|---|
| 27.01.2022 | 5.43 | 7.63 | 4.77 |
| 26.01.2022 | 6.69 | 8.31 | 5.53 |
| 25.01.2022 | 7.56 | 9.48 | 5.93 |
| 24.01.2022 | 7.31 | 12.3 | 5.34 |
| 23.01.2022 | 5.12 | 5.72 | 4.58 |
| 22.01.2022 | 4.85 | 5.34 | 4.58 |
| 21.01.2022 | 5.24 | 5.72 | 4.95 |
© Bayerisches Landesamt für Umwelt 2024