
- Start >
- Rivers >
- Discharge >
- Naab - Regen >
- Trausnitz u. d. Mühle >
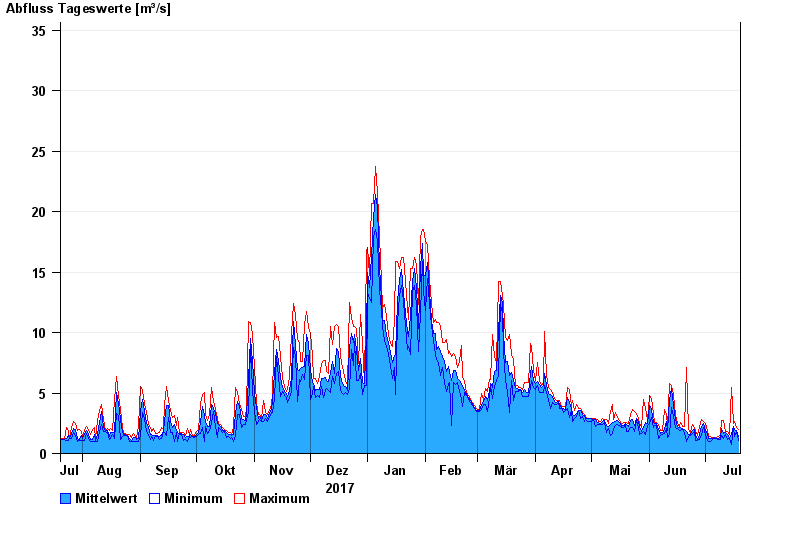
- Chart of year

Chart of year Trausnitz u. d. Mühle / Pfreimd
Discharge from 20.07.2017 to 19.07.2018
- 26.01.1995 Abfluss: 87,1 m³/s
- 27.03.1988 Abfluss: 84,3 m³/s
- 03.01.2003 Abfluss: 76,1 m³/s
- 22.12.1993 Abfluss: 73,7 m³/s
- 06.01.1982 Abfluss: 72,7 m³/s
| Date | Mean value [m³/s] | Maximum [m³/s] | Minimum [m³/s] |
|---|---|---|---|
| 19.07.2018 | 1.41 | 2.01 | 1.1 |
| 18.07.2018 | 1.91 | 2.13 | 1.8 |
| 17.07.2018 | 1.98 | 2.64 | 1.42 |
| 16.07.2018 | 2.22 | 2.52 | 2.03 |
| 15.07.2018 | 1.54 | 5.49 | 0.708 |
| 14.07.2018 | 1.35 | 1.53 | 1.27 |
| 13.07.2018 | 1.55 | 1.83 | 1.13 |
© Bayerisches Landesamt für Umwelt 2024