
- Start >
- Rivers >
- Discharge >
- Naab - Regen >
- Trausnitz u. d. Mühle >
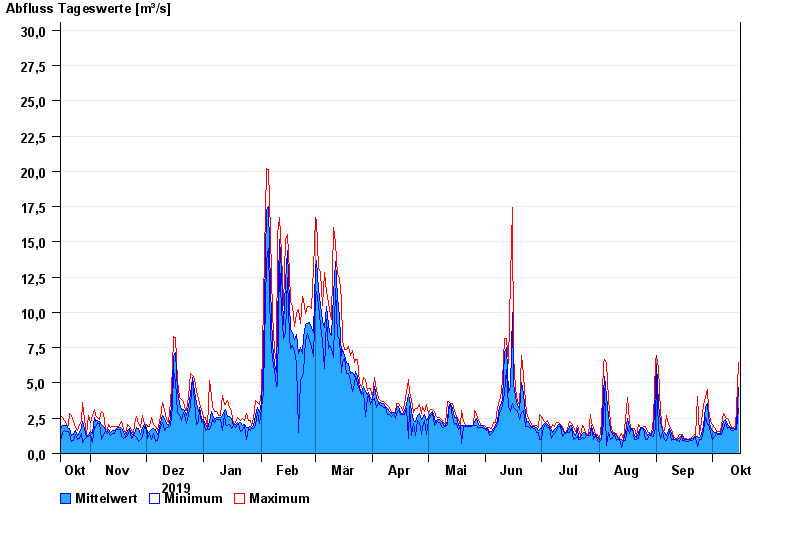
- Chart of year

Chart of year Trausnitz u. d. Mühle / Pfreimd
Discharge from 16.10.2019 to 15.10.2020
- 26.01.1995 Abfluss: 87,1 m³/s
- 27.03.1988 Abfluss: 84,3 m³/s
- 03.01.2003 Abfluss: 76,1 m³/s
- 22.12.1993 Abfluss: 73,7 m³/s
- 06.01.1982 Abfluss: 72,7 m³/s
| Date | Mean value [m³/s] | Maximum [m³/s] | Minimum [m³/s] |
|---|---|---|---|
| 15.10.2020 | 4.67 | 6.43 | 3.18 |
| 14.10.2020 | 1.98 | 3.18 | 1.67 |
| 13.10.2020 | 1.78 | 1.88 | 1.67 |
| 12.10.2020 | 1.77 | 1.87 | 1.66 |
| 11.10.2020 | 1.79 | 1.87 | 1.66 |
| 10.10.2020 | 1.9 | 2.2 | 1.86 |
| 09.10.2020 | 2.06 | 2.45 | 1.75 |
© Bayerisches Landesamt für Umwelt 2024