
- Start >
- Rivers >
- Discharge >
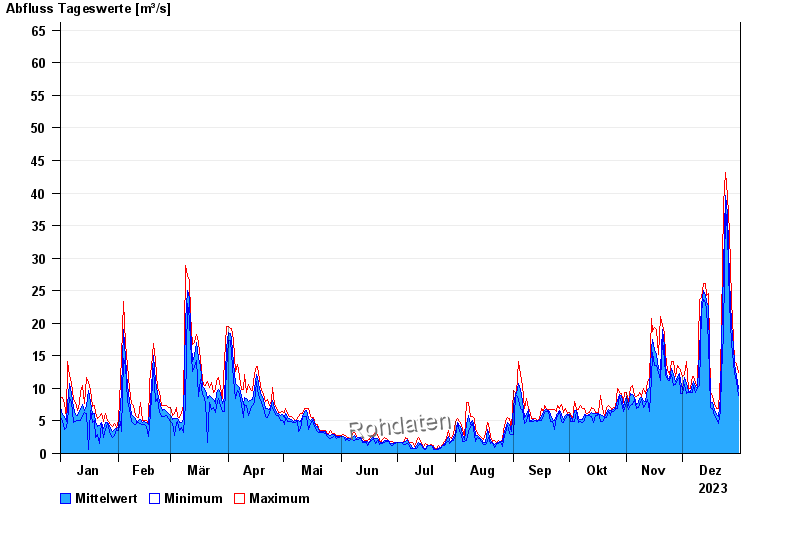
- Naab - Regen >
- Trausnitz u. d. Mühle >
- Chart of year

Chart of year Trausnitz u. d. Mühle / Pfreimd
Discharge from 01.01.2023 to 31.12.2023
- 26.01.1995 Abfluss: 87,1 m³/s
- 27.03.1988 Abfluss: 84,3 m³/s
- 03.01.2003 Abfluss: 76,1 m³/s
- 22.12.1993 Abfluss: 73,7 m³/s
- 06.01.1982 Abfluss: 72,7 m³/s
| Date | Mean value [m³/s] | Maximum [m³/s] | Minimum [m³/s] |
|---|---|---|---|
| 31.12.2023 | 10 | 12.5 | 8.91 |
| 30.12.2023 | 12 | 13.8 | 11.1 |
| 29.12.2023 | 13.6 | 14.1 | 12.5 |
| 28.12.2023 | 16.5 | 17.6 | 13.8 |
| 27.12.2023 | 19.8 | 23.5 | 17 |
| 26.12.2023 | 26.7 | 34 | 23.1 |
| 25.12.2023 | 36.8 | 39.6 | 34 |
© Bayerisches Landesamt für Umwelt 2024