
- Start >
- Rivers >
- Discharge >
- Naab - Regen >
- Trausnitz u. d. Mühle >
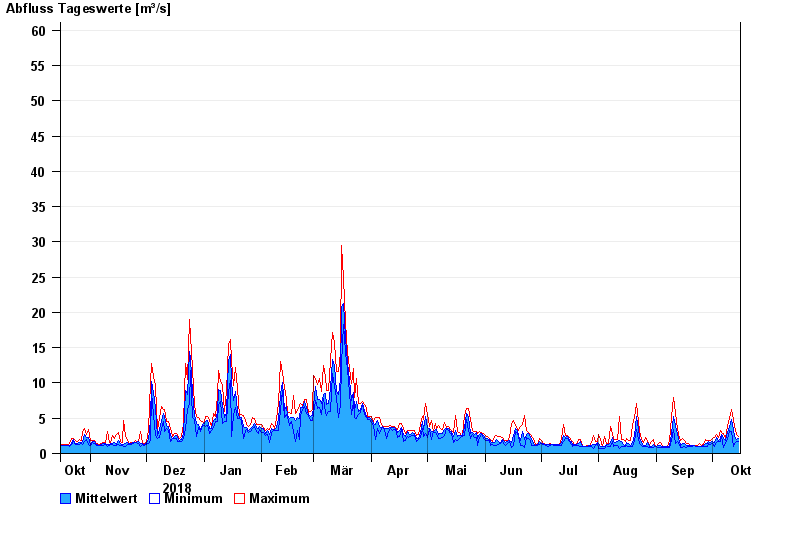
- Chart of year

Chart of year Trausnitz u. d. Mühle / Pfreimd
Discharge from 16.10.2018 to 15.10.2019
 Für diesen Pegel sind keine Jährlichkeiten hinterlegt.
| Date | Mean value [m³/s] | Maximum [m³/s] | Minimum [m³/s] |
|---|---|---|---|
| 15.10.2019 | 2.18 | 2.44 | 1.65 |
| 14.10.2019 | 1.96 | 2.71 | 1.75 |
| 13.10.2019 | 2.36 | 3.77 | 1.37 |
| 12.10.2019 | 3.39 | 4.82 | 1 |
| 11.10.2019 | 4.84 | 6.18 | 3.14 |
| 10.10.2019 | 3.84 | 5.01 | 3.3 |
| 09.10.2019 | 2.95 | 3.78 | 1.97 |
© Bayerisches Landesamt für Umwelt 2024