
- Start >
- Rivers >
- Discharge >
- Naab - Regen >
- Tiefenbach >
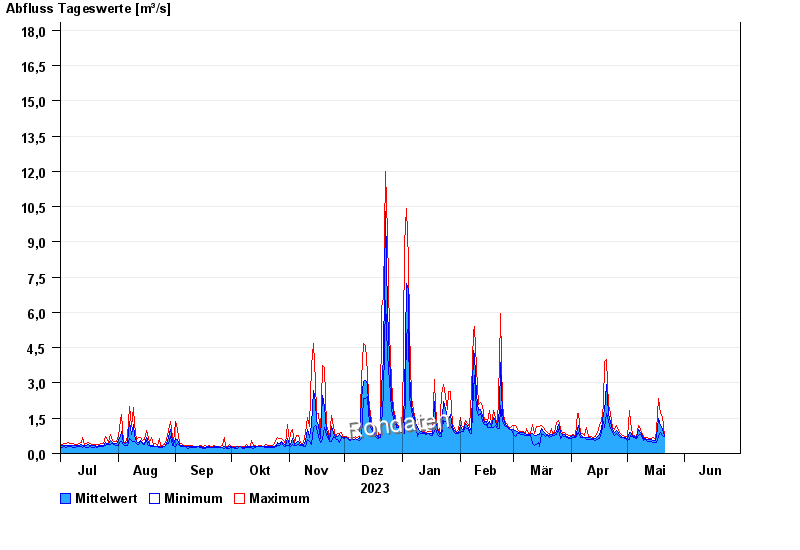
- Chart of year

Chart of year Tiefenbach / Bayerische Schwarzach
Discharge from 01.07.2023 to 30.06.2024
- 05.12.1988 Abfluss: 29,5 m³/s
- 26.01.1995 Abfluss: 26 m³/s
- 21.12.1993 Abfluss: 23,5 m³/s
- 26.02.1997 Abfluss: 19,7 m³/s
- 30.12.1986 Abfluss: 19,2 m³/s
| Date | Mean value [m³/s] | Maximum [m³/s] | Minimum [m³/s] |
|---|---|---|---|
| 20.05.2024 | 1.05 | 1.56 | 0.773 |
| 19.05.2024 | 1.2 | 1.72 | 0.91 |
| 18.05.2024 | 1.48 | 2.32 | 0.728 |
| 17.05.2024 | 0.712 | 0.958 | 0.468 |
| 16.05.2024 | 0.545 | 0.639 | 0.468 |
| 15.05.2024 | 0.546 | 0.683 | 0.468 |
| 14.05.2024 | 0.576 | 0.639 | 0.509 |
© Bayerisches Landesamt für Umwelt 2024