
- Start >
- Rivers >
- Discharge >
- Naab - Regen >
- Teisnach >
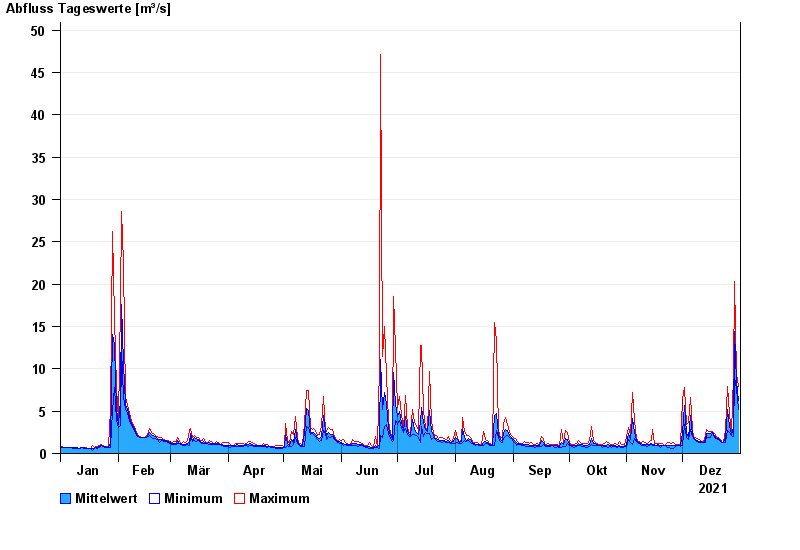
- Chart of year

Chart of year Teisnach / Teisnach
Discharge from 01.01.2021 to 31.12.2021
| Date | Mean value [m³/s] | Maximum [m³/s] | Minimum [m³/s] |
|---|---|---|---|
| 31.12.2021 | 6.31 | 7.87 | 5.23 |
| 30.12.2021 | 8.52 | 9.33 | 7.51 |
| 29.12.2021 | 14.4 | 20.3 | 9.08 |
| 28.12.2021 | 3.1 | 9.08 | 2.02 |
| 27.12.2021 | 2.27 | 2.52 | 2.12 |
| 26.12.2021 | 3.16 | 4.64 | 2.52 |
| 25.12.2021 | 5.14 | 7.91 | 2.75 |
© Bayerisches Landesamt für Umwelt 2024