
- Start >
- Rivers >
- Discharge >
- Naab - Regen >
- Teisnach >
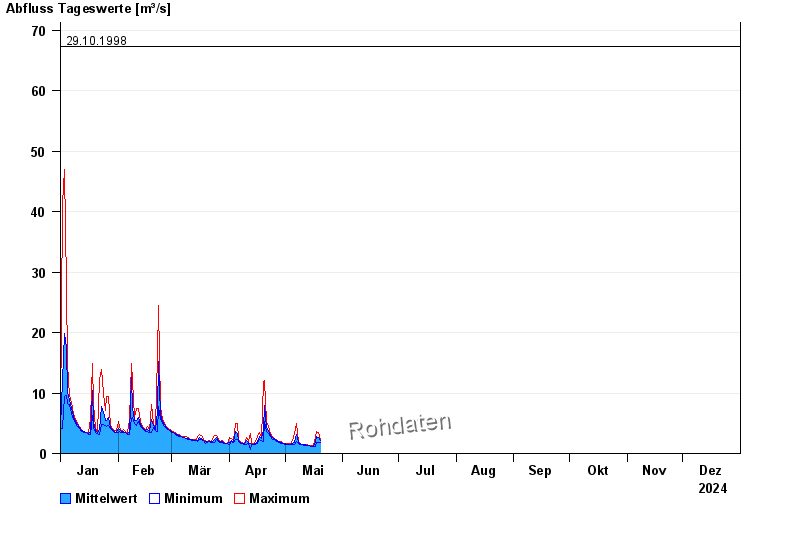
- Chart of year

Chart of year Teisnach / Teisnach
Discharge from 01.01.2024 to 31.12.2024
- 01.11.1998 Abfluss: 87,6 m³/s
- 05.12.1988 Abfluss: 79,7 m³/s
- 15.09.1998 Abfluss: 73,7 m³/s
- 23.12.1967 Abfluss: 71,7 m³/s
- 29.10.1998 Abfluss: 67,3 m³/s
| Date | Mean value [m³/s] | Maximum [m³/s] | Minimum [m³/s] |
|---|---|---|---|
| 07.06.2024 | 7.86 | 10 | 3.95 |
| 06.06.2024 | 4.36 | 5.48 | 3.67 |
| 05.06.2024 | 4.35 | 4.7 | 3.95 |
| 04.06.2024 | 5.32 | 5.97 | 4.7 |
| 03.06.2024 | 7.15 | 9.23 | 5.97 |
| 02.06.2024 | 12 | 16.6 | 7.89 |
| 01.06.2024 | 18.3 | 27.6 | 9.03 |
© Bayerisches Landesamt für Umwelt 2024