
- Start >
- Rivers >
- Discharge >
- Naab - Regen >
- Ösbühl >
- Chart of year

Chart of year Ösbühl / Danglesbach
Discharge from 02.12.2022 to 01.12.2023
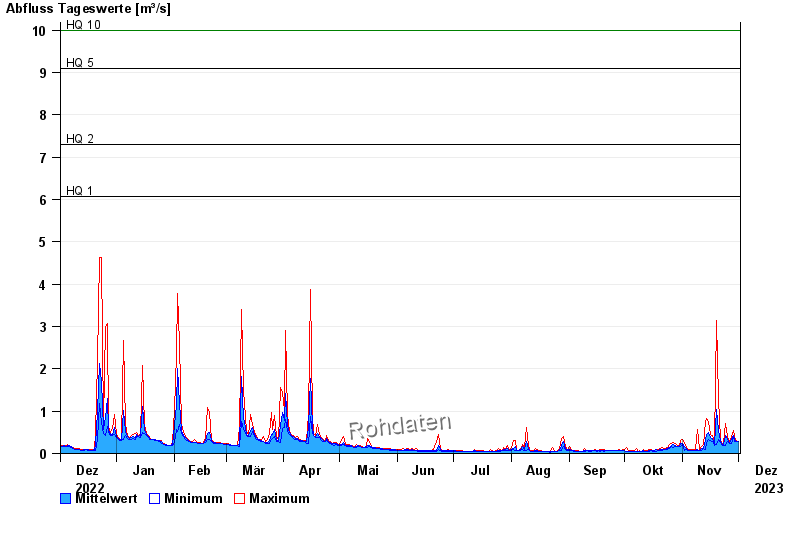
- HQ1 6,06 m³/s
- HQ2 7,3 m³/s
- HQ5 9,1 m³/s
- HQ10 10 m³/s
- HQ20 11 m³/s
- HQ50 13 m³/s
- HQ100 14 m³/s
| Date | Mean value [m³/s] | Maximum [m³/s] | Minimum [m³/s] |
|---|---|---|---|
| 01.12.2023 | 0.278 | 0.289 | 0.273 |
| 30.11.2023 | 0.279 | 0.289 | 0.273 |
| 29.11.2023 | 0.324 | 0.393 | 0.289 |
| 28.11.2023 | 0.437 | 0.534 | 0.393 |
| 27.11.2023 | 0.329 | 0.412 | 0.227 |
| 26.11.2023 | 0.247 | 0.273 | 0.227 |
| 25.11.2023 | 0.323 | 0.393 | 0.273 |
© Bayerisches Landesamt für Umwelt 2024