
- Start >
- Rivers >
- Discharge >
- Naab - Regen >
- Ösbühl >
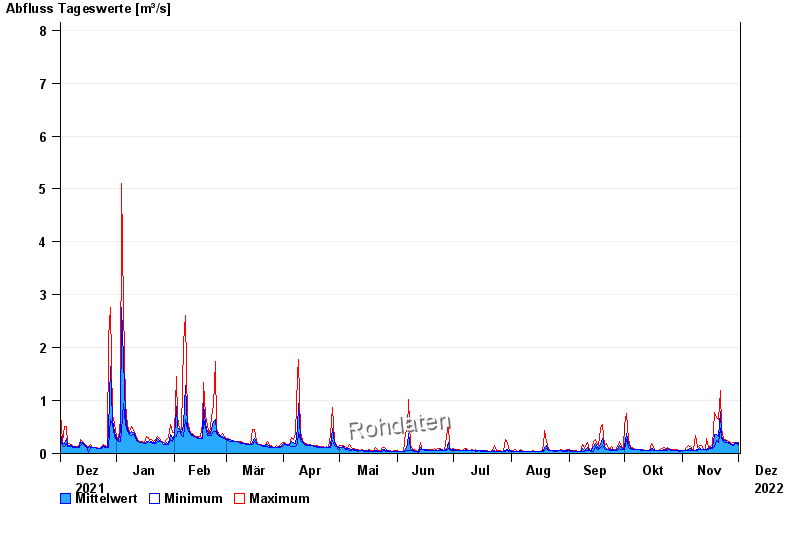
- Chart of year

Chart of year Ösbühl / Danglesbach
Discharge from 02.12.2021 to 01.12.2022
- 21.12.1993 Abfluss: 12,5 m³/s
- 01.11.1998 Abfluss: 12 m³/s
- 26.01.1995 Abfluss: 12 m³/s
- 26.02.1997 Abfluss: 10,9 m³/s
- 13.07.1995 Abfluss: 10 m³/s
| Date | Mean value [m³/s] | Maximum [m³/s] | Minimum [m³/s] |
|---|---|---|---|
| 01.12.2022 | 0.185 | 0.2 | 0.173 |
| 30.11.2022 | 0.199 | 0.214 | 0.186 |
| 29.11.2022 | 0.191 | 0.214 | 0.173 |
| 28.11.2022 | 0.172 | 0.2 | 0.159 |
| 27.11.2022 | 0.177 | 0.186 | 0.173 |
| 26.11.2022 | 0.209 | 0.229 | 0.186 |
| 25.11.2022 | 0.214 | 0.244 | 0.2 |
© Bayerisches Landesamt für Umwelt 2024