
- Start >
- Rivers >
- Discharge >
- Naab - Regen >
- Ösbühl >
- Chart of year

Chart of year Ösbühl / Danglesbach
Discharge from 29.03.2024 to 28.03.2025
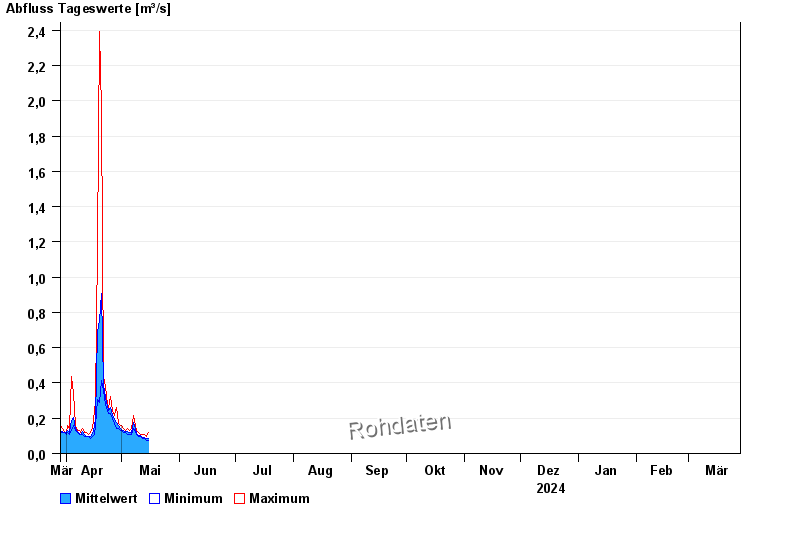
| Date | Mean value [m³/s] | Maximum [m³/s] | Minimum [m³/s] |
|---|---|---|---|
| 29.04.2024 | 0.158 | 0.17 | 0.144 |
| 28.04.2024 | 0.175 | 0.259 | 0.144 |
| 27.04.2024 | 0.19 | 0.214 | 0.17 |
| 26.04.2024 | 0.218 | 0.244 | 0.199 |
| 25.04.2024 | 0.262 | 0.325 | 0.228 |
| 24.04.2024 | 0.243 | 0.259 | 0.228 |
| 23.04.2024 | 0.265 | 0.275 | 0.244 |
© Bayerisches Landesamt für Umwelt 2024