
- Start >
- Rivers >
- Discharge >
- Naab - Regen >
- Ösbühl >
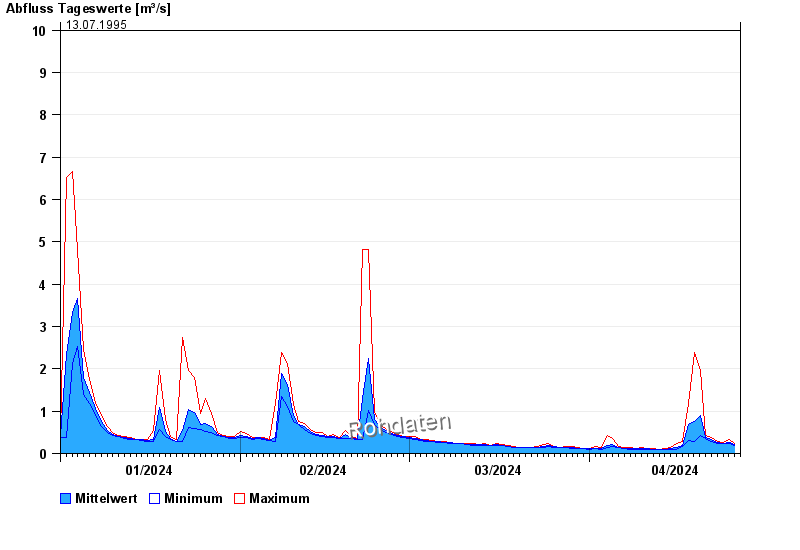
- Chart of year

Chart of year Ösbühl / Danglesbach
Discharge from 01.01.2024 to 26.04.2024
- 21.12.1993 Abfluss: 12,5 m³/s
- 01.11.1998 Abfluss: 12 m³/s
- 26.01.1995 Abfluss: 12 m³/s
- 26.02.1997 Abfluss: 10,9 m³/s
- 13.07.1995 Abfluss: 10 m³/s
| Date | Mean value [m³/s] | Maximum [m³/s] | Minimum [m³/s] |
|---|---|---|---|
| 26.04.2024 | 0.244 | 0.244 | 0.244 |
| 25.04.2024 | 0.262 | 0.325 | 0.228 |
| 24.04.2024 | 0.243 | 0.259 | 0.228 |
| 23.04.2024 | 0.265 | 0.275 | 0.244 |
| 22.04.2024 | 0.319 | 0.379 | 0.275 |
| 21.04.2024 | 0.387 | 0.436 | 0.36 |
| 20.04.2024 | 0.905 | 1.95 | 0.416 |
© Bayerisches Landesamt für Umwelt 2024