
- Start >
- Rivers >
- Discharge >
- Naab - Regen >
- Ösbühl >
- Chart of year

Chart of year Ösbühl / Danglesbach
Discharge from 30.01.2023 to 29.01.2024
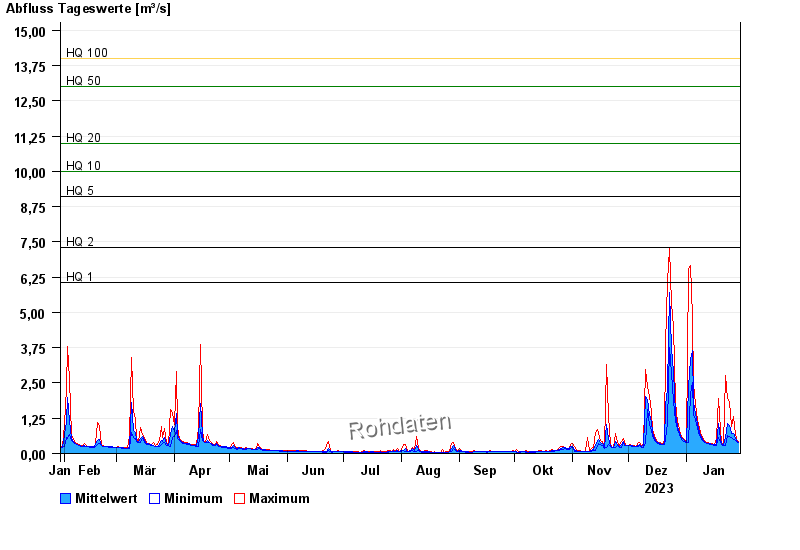
- HQ1 6,06 m³/s
- HQ2 7,3 m³/s
- HQ5 9,1 m³/s
- HQ10 10 m³/s
- HQ20 11 m³/s
- HQ50 13 m³/s
- HQ100 14 m³/s
| Date | Mean value [m³/s] | Maximum [m³/s] | Minimum [m³/s] |
|---|---|---|---|
| 29.01.2024 | 0.402 | 0.431 | 0.393 |
| 28.01.2024 | 0.45 | 0.492 | 0.431 |
| 27.01.2024 | 0.647 | 0.955 | 0.492 |
| 26.01.2024 | 0.709 | 1.3 | 0.512 |
| 25.01.2024 | 0.694 | 0.955 | 0.556 |
| 24.01.2024 | 0.978 | 1.8 | 0.601 |
| 23.01.2024 | 1.05 | 1.96 | 0.624 |
© Bayerisches Landesamt für Umwelt 2024