
- Start >
- Rivers >
- Discharge >
- Naab - Regen >
- Ösbühl >
- Chart of year

Chart of year Ösbühl / Danglesbach
Discharge from 28.04.2024 to 27.04.2025
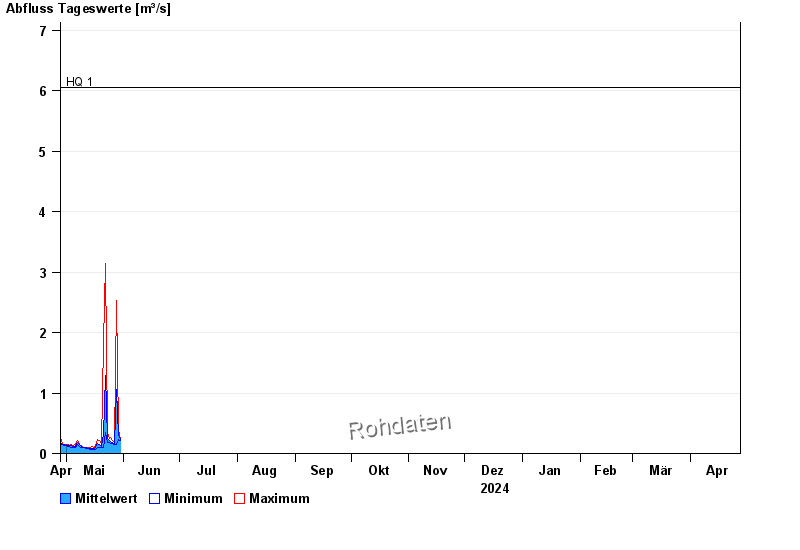
- HQ1 6,06 m³/s
- HQ2 7,3 m³/s
- HQ5 9,1 m³/s
- HQ10 10 m³/s
- HQ20 11 m³/s
- HQ50 13 m³/s
- HQ100 14 m³/s
| Date | Mean value [m³/s] | Maximum [m³/s] | Minimum [m³/s] |
|---|---|---|---|
| 09.05.2024 | 0.131 | 0.131 | 0.131 |
| 08.05.2024 | 0.141 | 0.157 | 0.118 |
| 07.05.2024 | 0.174 | 0.214 | 0.144 |
| 06.05.2024 | 0.118 | 0.144 | 0.106 |
| 05.05.2024 | 0.118 | 0.131 | 0.106 |
| 04.05.2024 | 0.125 | 0.144 | 0.106 |
| 03.05.2024 | 0.127 | 0.131 | 0.118 |
© Bayerisches Landesamt für Umwelt 2024