
- Start >
- Rivers >
- Discharge >
- Naab - Regen >
- Obersdorf >
- Chart of year

Chart of year Obersdorf / Rosenbach
Discharge from 23.05.2022 to 22.05.2023
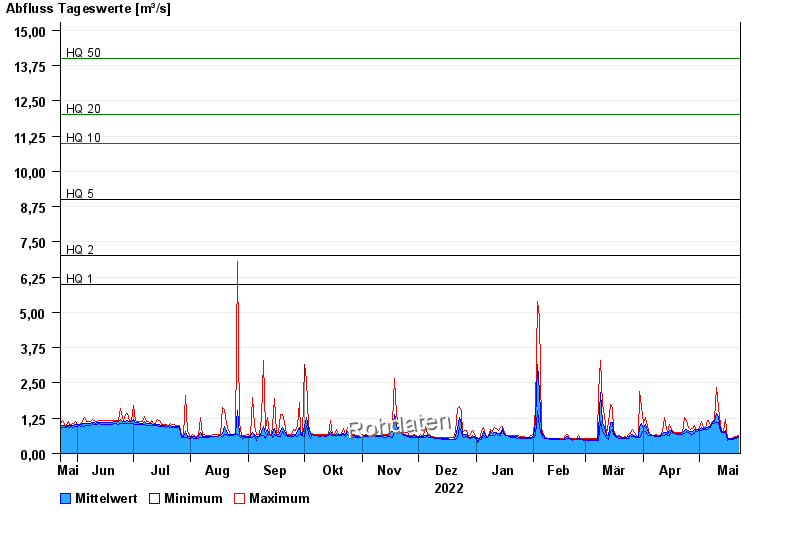
- HQ1 6 m³/s
- HQ2 7 m³/s
- HQ5 9 m³/s
- HQ10 11 m³/s
- HQ20 12 m³/s
- HQ50 14 m³/s
- HQ100 16 m³/s
| Date | Mean value [m³/s] | Maximum [m³/s] | Minimum [m³/s] |
|---|---|---|---|
| 22.05.2023 | 0.6 | 0.631 | 0.564 |
| 21.05.2023 | 0.58 | 0.596 | 0.533 |
| 20.05.2023 | 0.562 | 0.596 | 0.533 |
| 19.05.2023 | 0.547 | 0.564 | 0.503 |
| 18.05.2023 | 0.522 | 0.533 | 0.503 |
| 17.05.2023 | 0.521 | 0.533 | 0.503 |
| 16.05.2023 | 0.511 | 0.533 | 0.476 |
© Bayerisches Landesamt für Umwelt 2024