
- Start >
- Rivers >
- Discharge >
- Naab - Regen >
- Obersdorf >
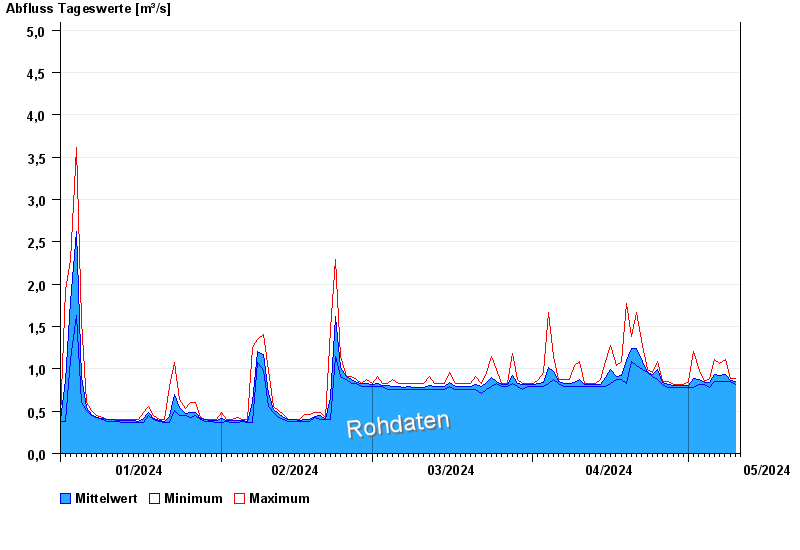
- Chart of year

Chart of year Obersdorf / Rosenbach
Discharge from 01.01.2024 to 10.05.2024
- 26.01.1995 Abfluss: 13,2 m³/s
- 03.01.2003 Abfluss: 12,1 m³/s
- 16.05.2006 Abfluss: 11,8 m³/s
- 31.07.2002 Abfluss: 11,2 m³/s
- 07.07.2006 Abfluss: 10,9 m³/s
| Date | Mean value [m³/s] | Maximum [m³/s] | Minimum [m³/s] |
|---|---|---|---|
| 10.05.2024 | 0.852 | 0.855 | 0.815 |
| 09.05.2024 | 0.863 | 0.887 | 0.855 |
| 08.05.2024 | 0.934 | 1.11 | 0.855 |
| 07.05.2024 | 0.92 | 1.06 | 0.855 |
| 06.05.2024 | 0.934 | 1.11 | 0.855 |
| 05.05.2024 | 0.84 | 0.887 | 0.776 |
| 04.05.2024 | 0.834 | 0.855 | 0.815 |
© Bayerisches Landesamt für Umwelt 2024