
- Start >
- Rivers >
- Discharge >
- Naab - Regen >
- Obersdorf >
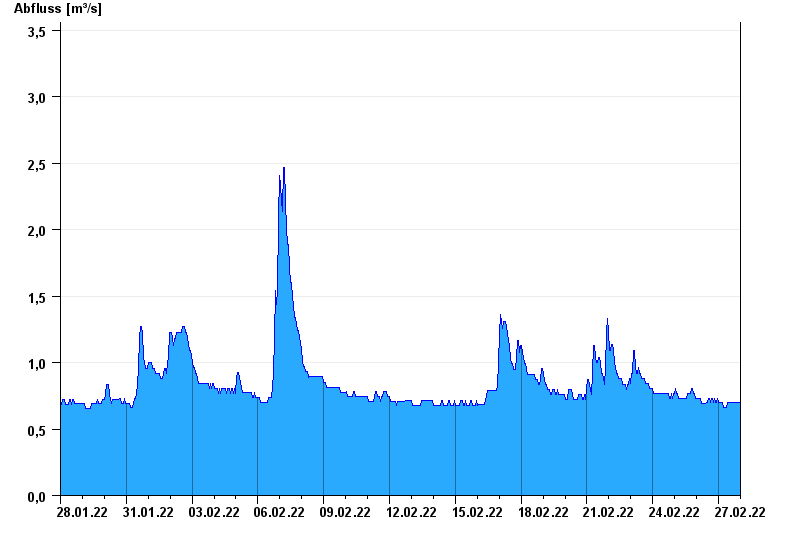
- Chart of month

Chart of month Obersdorf / Rosenbach
Discharge from 28.01.2022 to 27.02.2022
- 26.01.1995 Abfluss: 13,2 m³/s
- 03.01.2003 Abfluss: 12,1 m³/s
- 16.05.2006 Abfluss: 11,8 m³/s
- 31.07.2002 Abfluss: 11,2 m³/s
- 07.07.2006 Abfluss: 10,9 m³/s
| Date | Runoff [m³/s] |
|---|---|
| 27.02.2022 23:45 | 0.699 |
| 27.02.2022 23:30 | 0.699 |
| 27.02.2022 23:15 | 0.699 |
| 27.02.2022 23:00 | 0.699 |
| 27.02.2022 22:45 | 0.699 |
| 27.02.2022 22:30 | 0.699 |
| 27.02.2022 22:15 | 0.699 |
© Bayerisches Landesamt für Umwelt 2024