
- Start >
- Rivers >
- Discharge >
- Naab - Regen >
- Münchshofen >
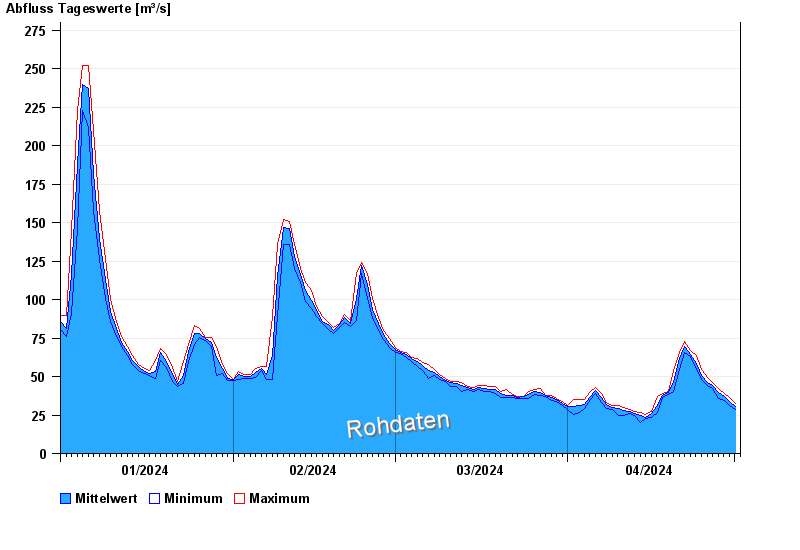
- Chart of year

Chart of year Münchshofen / Naab
Discharge from 01.01.2024 to 01.05.2024
| Date | Mean value [m³/s] | Maximum [m³/s] | Minimum [m³/s] |
|---|---|---|---|
| 01.05.2024 | 31.1 | 32.7 | 30.1 |
| 30.04.2024 | 34.1 | 36.5 | 31.3 |
| 29.04.2024 | 36.8 | 39.3 | 34.6 |
| 28.04.2024 | 39.4 | 42 | 35.9 |
| 27.04.2024 | 44 | 46.3 | 42 |
| 26.04.2024 | 46.2 | 49.2 | 44.2 |
| 25.04.2024 | 50.4 | 54.5 | 47.8 |
© Bayerisches Landesamt für Umwelt 2024