
- Start >
- Rivers >
- Discharge >
- Naab - Regen >
- Michelfeld >
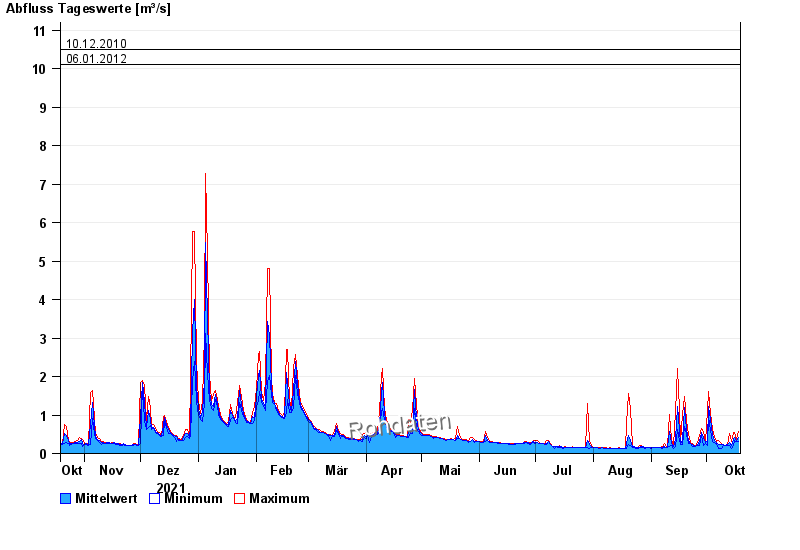
- Chart of year

Chart of year Michelfeld / Pegnitz
Discharge from 19.10.2021 to 18.10.2022
- 09.01.2011 Abfluss: 20,3 m³/s
- 14.01.2011 Abfluss: 19,2 m³/s
- 17.12.2011 Abfluss: 14,6 m³/s
- 10.12.2010 Abfluss: 10,5 m³/s
- 06.01.2012 Abfluss: 10,1 m³/s
| Date | Mean value [m³/s] | Maximum [m³/s] | Minimum [m³/s] |
|---|---|---|---|
| 18.10.2022 | 0.409 | 0.578 | 0.305 |
| 17.10.2022 | 0.325 | 0.36 | 0.305 |
| 16.10.2022 | 0.407 | 0.551 | 0.332 |
| 15.10.2022 | 0.369 | 0.551 | 0.212 |
| 14.10.2022 | 0.217 | 0.305 | 0.139 |
| 13.10.2022 | 0.279 | 0.524 | 0.212 |
| 12.10.2022 | 0.224 | 0.234 | 0.212 |
© Bayerisches Landesamt für Umwelt 2024