
- Start >
- Rivers >
- Discharge >
- Naab - Regen >
- Michelfeld >
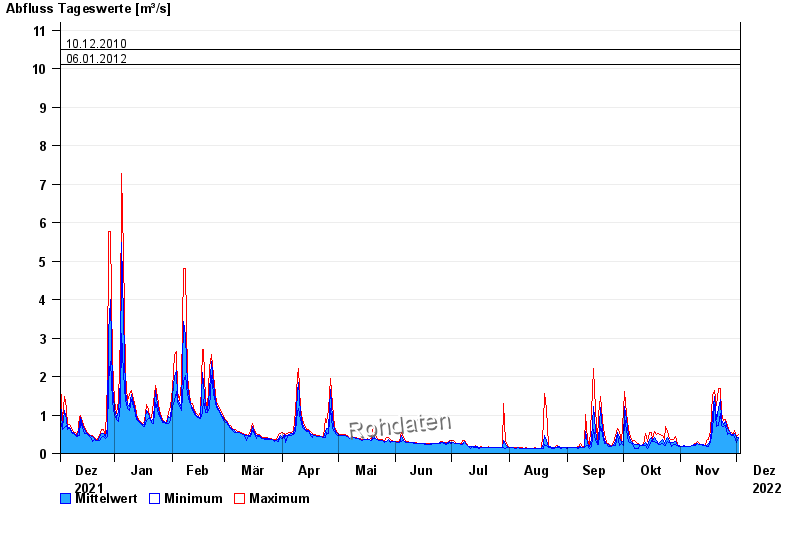
- Chart of year

Chart of year Michelfeld / Pegnitz
Discharge from 03.12.2021 to 02.12.2022
- 09.01.2011 Abfluss: 20,3 m³/s
- 14.01.2011 Abfluss: 19,2 m³/s
- 17.12.2011 Abfluss: 14,6 m³/s
- 10.12.2010 Abfluss: 10,5 m³/s
- 06.01.2012 Abfluss: 10,1 m³/s
| Date | Mean value [m³/s] | Maximum [m³/s] | Minimum [m³/s] |
|---|---|---|---|
| 02.12.2022 | 0.423 | 0.494 | 0.384 |
| 01.12.2022 | 0.405 | 0.439 | 0.279 |
| 30.11.2022 | 0.513 | 0.601 | 0.439 |
| 29.11.2022 | 0.499 | 0.521 | 0.466 |
| 28.11.2022 | 0.502 | 0.547 | 0.466 |
| 27.11.2022 | 0.56 | 0.574 | 0.521 |
| 26.11.2022 | 0.65 | 0.734 | 0.494 |
© Bayerisches Landesamt für Umwelt 2024