
- Start >
- Rivers >
- Discharge >
- Naab - Regen >
- Michelfeld >
- Chart of year

Chart of year Michelfeld / Pegnitz
Discharge from 24.04.2024 to 23.04.2025
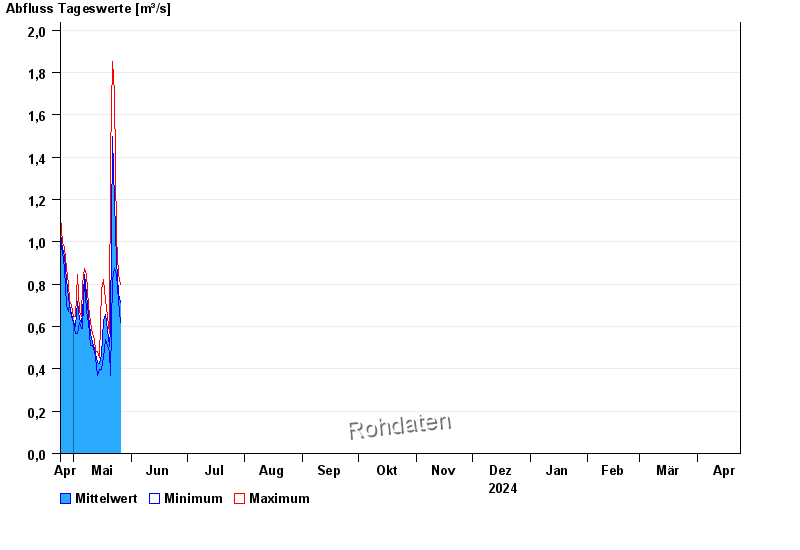
| Date | Mean value [m³/s] | Maximum [m³/s] | Minimum [m³/s] |
|---|---|---|---|
| 04.05.2024 | 0.663 | 0.671 | 0.645 |
| 03.05.2024 | 0.719 | 0.846 | 0.565 |
| 02.05.2024 | 0.599 | 0.645 | 0.565 |
| 01.05.2024 | 0.623 | 0.645 | 0.619 |
| 30.04.2024 | 0.655 | 0.697 | 0.645 |
| 29.04.2024 | 0.706 | 0.722 | 0.697 |
| 28.04.2024 | 0.738 | 0.797 | 0.671 |
© Bayerisches Landesamt für Umwelt 2024