
- Start >
- Rivers >
- Discharge >
- Naab - Regen >
- Michelfeld >
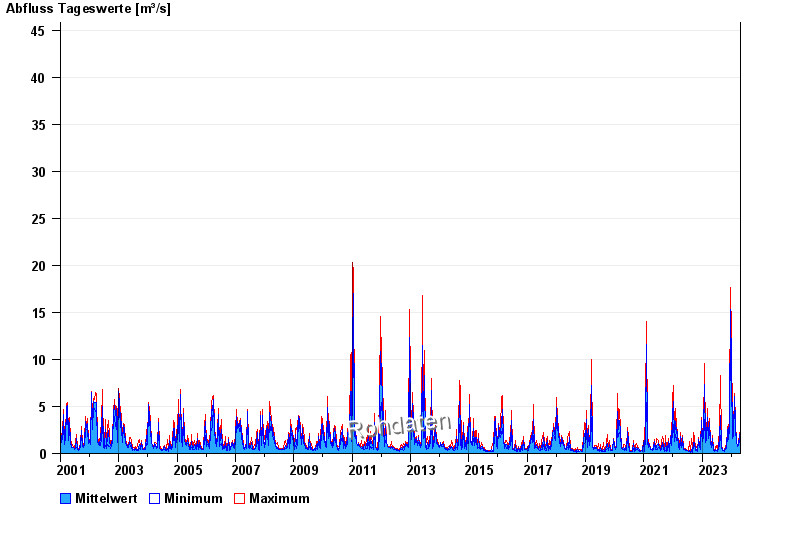
- Chart of total period

Chart of total period Michelfeld / Pegnitz
Discharge from 01.01.2001 to 26.04.2024
 Für diesen Pegel sind keine Jährlichkeiten hinterlegt.
| Date | Mean value [m³/s] | Maximum [m³/s] | Minimum [m³/s] |
|---|---|---|---|
| 26.04.2024 | 0.955 | 0.971 | 0.921 |
| 25.04.2024 | 0.967 | 0.997 | 0.948 |
| 24.04.2024 | 1.04 | 1.12 | 0.997 |
| 23.04.2024 | 1.27 | 1.49 | 1.12 |
| 22.04.2024 | 2.18 | 2.59 | 1.49 |
| 21.04.2024 | 1.66 | 2.35 | 1.33 |
| 20.04.2024 | 1.76 | 2.02 | 1.41 |
© Bayerisches Landesamt für Umwelt 2024