
- Start >
- Rivers >
- Discharge >
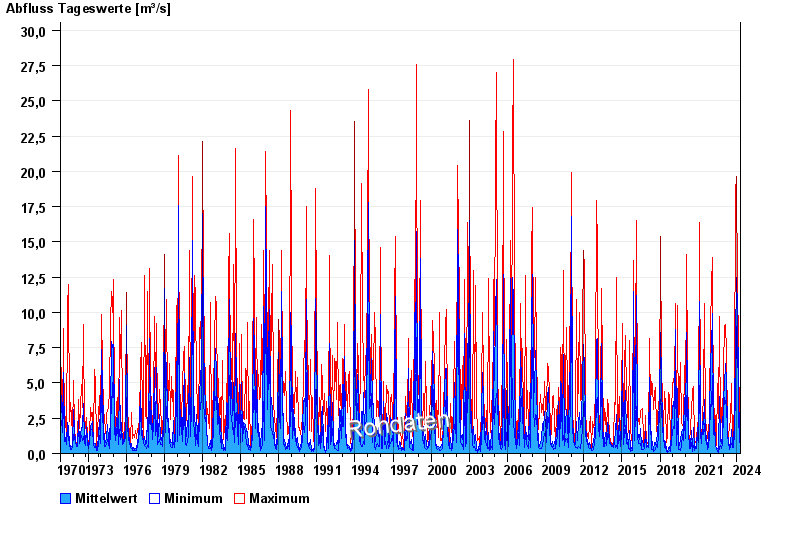
- Naab - Regen >
- Marktredwitz >
- Chart of total period

Chart of total period Marktredwitz / Kössein
Discharge from 01.11.1970 to 29.04.2024
| Date | Mean value [m³/s] | Maximum [m³/s] | Minimum [m³/s] |
|---|---|---|---|
| 29.04.2024 | 0.633 | 0.691 | 0.605 |
| 28.04.2024 | 0.783 | 0.83 | 0.691 |
| 27.04.2024 | 0.94 | 1.09 | 0.83 |
| 26.04.2024 | 1.08 | 1.21 | 0.982 |
| 25.04.2024 | 1.08 | 1.26 | 0.982 |
| 24.04.2024 | 1.07 | 1.26 | 0.982 |
| 23.04.2024 | 1.29 | 1.72 | 1.09 |
© Bayerisches Landesamt für Umwelt 2024