
- Start >
- Rivers >
- Discharge >
- Naab - Regen >
- Marienthal >
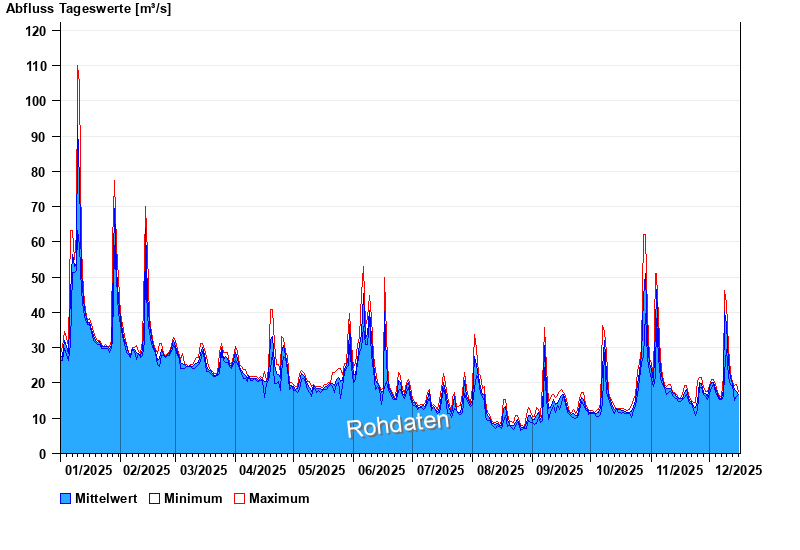
- Chart of year

Chart of year Marienthal / Regen
Discharge from 01.01.2025 to 16.12.2025
| Date | Mean value [m³/s] | Maximum [m³/s] | Minimum [m³/s] |
|---|---|---|---|
| 16.12.2025 | 16.8 | 17.5 | 16.6 |
| 15.12.2025 | 17.7 | 19.7 | 16.1 |
| 14.12.2025 | 18.2 | 19.3 | 14.9 |
| 13.12.2025 | 19.9 | 20.1 | 19.3 |
| 12.12.2025 | 21.5 | 23 | 19.7 |
| 11.12.2025 | 25.8 | 30 | 21.6 |
| 10.12.2025 | 36.6 | 42.6 | 29.5 |
© Bayerisches Landesamt für Umwelt 2025