
- Start >
- Rivers >
- Discharge >
- Naab - Regen >
- Lorenzreuth >
- Chart of year

Chart of year Lorenzreuth / Röslau
Discharge from 30.03.2024 to 29.03.2025
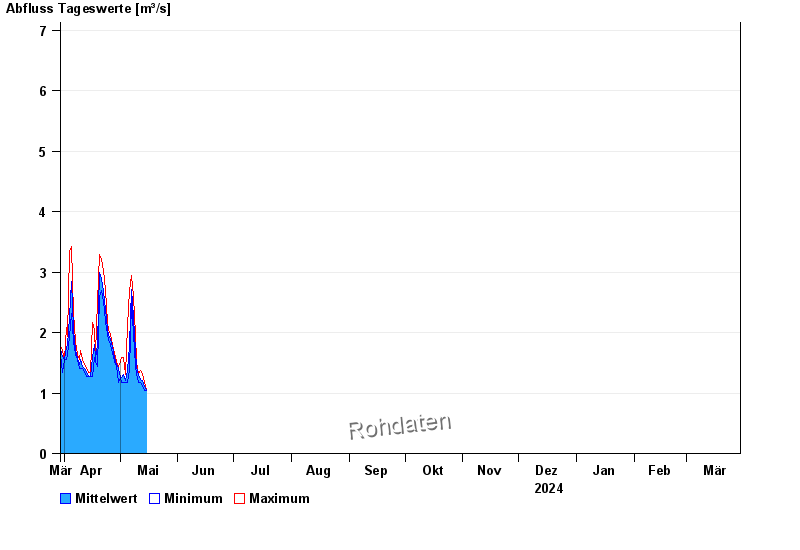
- HQ2 25 m³/s
- HQ5 32 m³/s
- HQ10 38 m³/s
- HQ20 46 m³/s
- HQ50 57 m³/s
- HQ100 64 m³/s
| Date | Mean value [m³/s] | Maximum [m³/s] | Minimum [m³/s] |
|---|---|---|---|
| 11.05.2024 | 1.29 | 1.31 | 1.24 |
| 10.05.2024 | 1.42 | 1.52 | 1.31 |
| 09.05.2024 | 1.7 | 1.96 | 1.44 |
| 08.05.2024 | 2.25 | 2.6 | 1.96 |
| 07.05.2024 | 2.72 | 2.94 | 2.52 |
| 06.05.2024 | 1.79 | 2.69 | 1.37 |
| 05.05.2024 | 1.38 | 2.12 | 1.18 |
© Bayerisches Landesamt für Umwelt 2024