
- Start >
- Rivers >
- Discharge >
- Naab - Regen >
- Lorenzreuth >
- Chart of year

Chart of year Lorenzreuth / Röslau
Discharge from 01.01.2020 to 31.12.2020
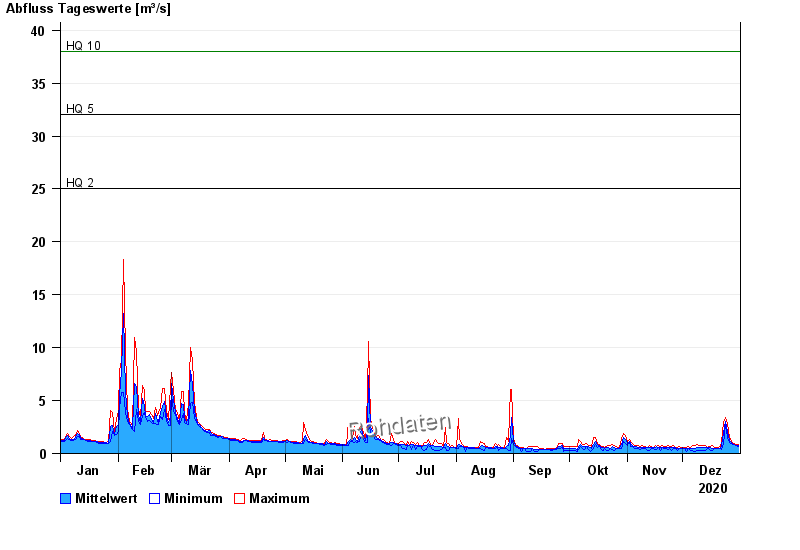
- HQ2 25 m³/s
- HQ5 32 m³/s
- HQ10 38 m³/s
- HQ20 46 m³/s
- HQ50 57 m³/s
- HQ100 64 m³/s
| Date | Mean value [m³/s] | Maximum [m³/s] | Minimum [m³/s] |
|---|---|---|---|
| 31.12.2020 | 0.767 | 0.878 | 0.677 |
| 30.12.2020 | 0.793 | 0.878 | 0.725 |
| 29.12.2020 | 0.886 | 0.987 | 0.827 |
| 28.12.2020 | 0.892 | 0.987 | 0.827 |
| 27.12.2020 | 1 | 1.1 | 0.934 |
| 26.12.2020 | 1.27 | 1.55 | 1.04 |
| 25.12.2020 | 2.12 | 2.87 | 1.55 |
© Bayerisches Landesamt für Umwelt 2024