
- Start >
- Rivers >
- Discharge >
- Naab - Regen >
- Lorenzreuth >
- Chart of year

Chart of year Lorenzreuth / Röslau
Discharge from 01.01.2023 to 31.12.2023
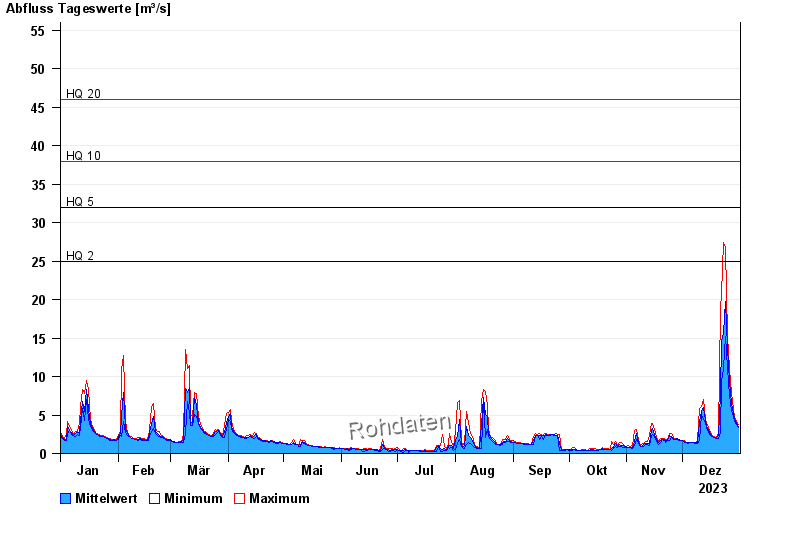
- HQ2 25 m³/s
- HQ5 32 m³/s
- HQ10 38 m³/s
- HQ20 46 m³/s
- HQ50 57 m³/s
- HQ100 64 m³/s
| Date | Mean value [m³/s] | Maximum [m³/s] | Minimum [m³/s] |
|---|---|---|---|
| 31.12.2023 | 3.56 | 3.71 | 3.43 |
| 30.12.2023 | 3.93 | 4.18 | 3.71 |
| 29.12.2023 | 4.49 | 4.78 | 4.18 |
| 28.12.2023 | 5.16 | 5.76 | 4.78 |
| 27.12.2023 | 6.53 | 7.81 | 5.65 |
| 26.12.2023 | 9.37 | 11.1 | 7.56 |
| 25.12.2023 | 13.8 | 15.2 | 11.1 |
© Bayerisches Landesamt für Umwelt 2024