
- Start >
- Rivers >
- Discharge >
- Naab - Regen >
- Kötzting >
- Chart of year

Chart of year Kötzting / Weißer Regen
Discharge from 01.01.2023 to 31.12.2023
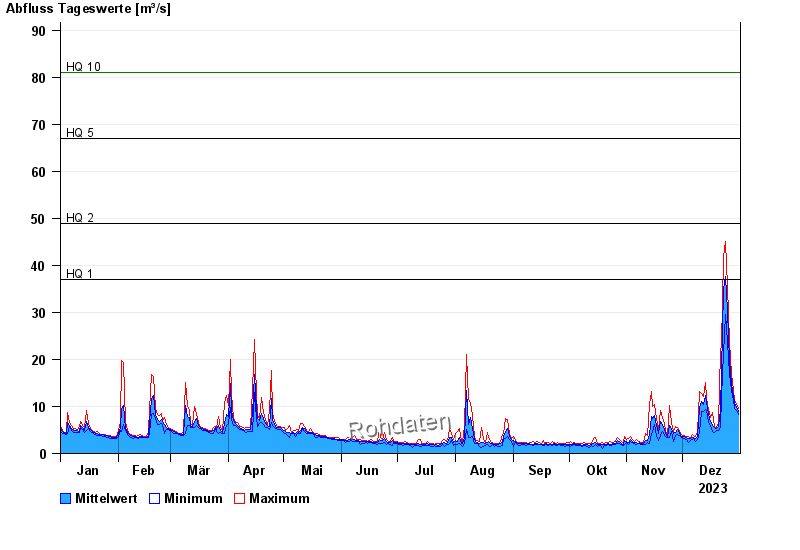
- HQ1 37 m³/s
- HQ2 49 m³/s
- HQ5 67 m³/s
- HQ10 81 m³/s
- HQ20 100 m³/s
- HQ50 120 m³/s
- HQ100 140 m³/s
| Date | Mean value [m³/s] | Maximum [m³/s] | Minimum [m³/s] |
|---|---|---|---|
| 31.12.2023 | 8.92 | 9.57 | 8.23 |
| 30.12.2023 | 9.77 | 10.5 | 9.11 |
| 29.12.2023 | 10.9 | 11.5 | 9.57 |
| 28.12.2023 | 12.2 | 13.5 | 11.3 |
| 27.12.2023 | 14.9 | 16.7 | 13.3 |
| 26.12.2023 | 19.8 | 23.7 | 16.7 |
| 25.12.2023 | 30.4 | 35.5 | 23.7 |
© Bayerisches Landesamt für Umwelt 2024