
- Start >
- Rivers >
- Discharge >
- Naab - Regen >
- Kempten >
- Chart of year

Chart of year Kempten / Iller
Discharge from 01.01.2018 to 31.12.2018
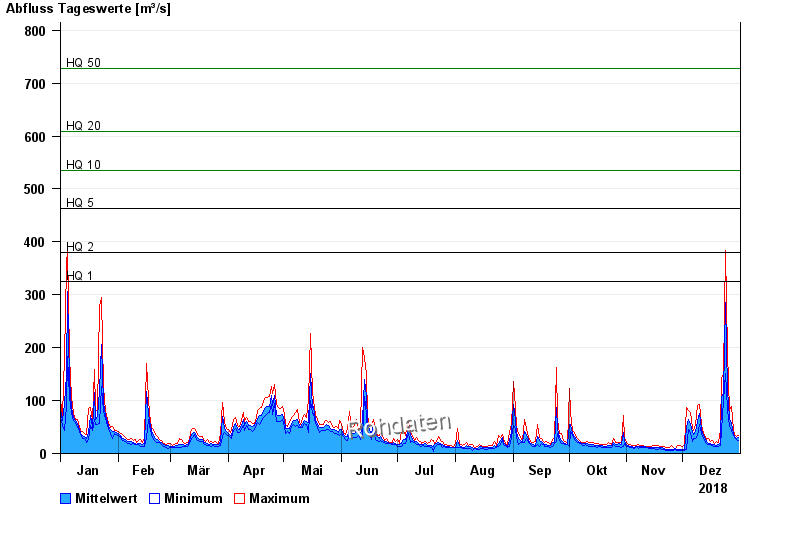
- HQ1 326 m³/s
- HQ2 379 m³/s
- HQ5 463 m³/s
- HQ10 534 m³/s
- HQ20 609 m³/s
- HQ50 728 m³/s
- HQ100 829 m³/s
| Date | Mean value [m³/s] | Maximum [m³/s] | Minimum [m³/s] |
|---|---|---|---|
| 31.12.2018 | 30.1 | 34.9 | 25.3 |
| 30.12.2018 | 29.2 | 32.7 | 27.2 |
| 29.12.2018 | 32.8 | 35.6 | 29.9 |
| 28.12.2018 | 37.7 | 46 | 33.4 |
| 27.12.2018 | 56.4 | 88.6 | 44.4 |
| 26.12.2018 | 65.9 | 82.1 | 51.3 |
| 25.12.2018 | 121 | 190 | 83.2 |
© Bayerisches Landesamt für Umwelt 2024