
- Start >
- Rivers >
- Discharge >
- Naab - Regen >
- Kempten >
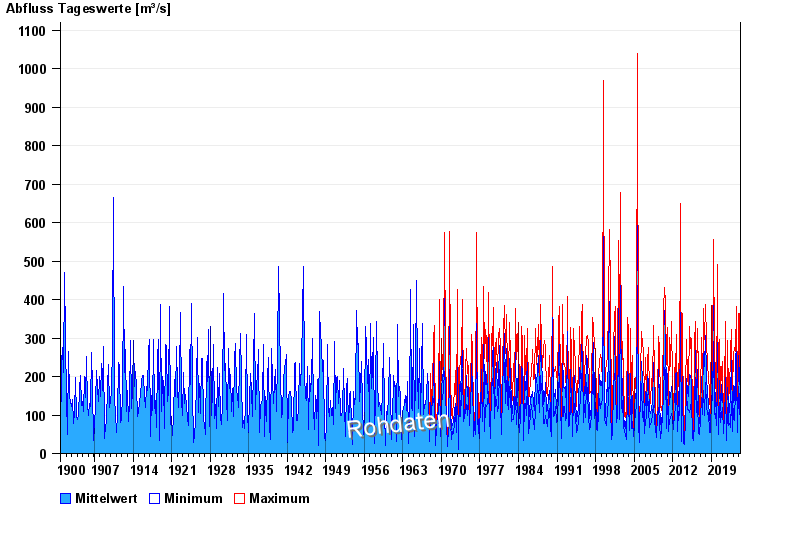
- Chart of total period

Chart of total period Kempten / Iller
Discharge from 01.11.1900 to 26.04.2024
| Date | Mean value [m³/s] | Maximum [m³/s] | Minimum [m³/s] |
|---|---|---|---|
| 26.04.2024 | 42.5 | 44.4 | 39.6 |
| 25.04.2024 | 41.4 | 44.4 | 38.8 |
| 24.04.2024 | 40.7 | 43.5 | 38 |
| 23.04.2024 | 44 | 47.7 | 35 |
| 22.04.2024 | 50.2 | 57.6 | 38 |
| 21.04.2024 | 57.8 | 63.4 | 54.8 |
| 20.04.2024 | 65.5 | 70.4 | 59.5 |
© Bayerisches Landesamt für Umwelt 2024