
- Start >
- Rivers >
- Discharge >
- Naab - Regen >
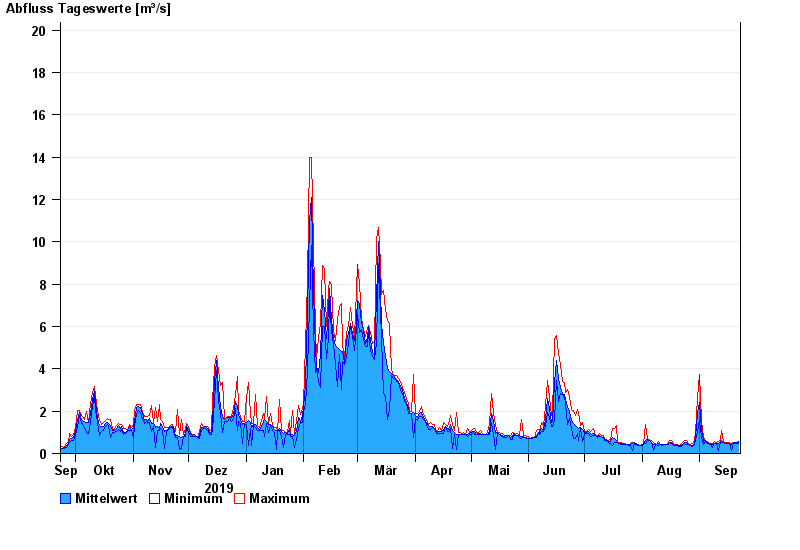
- Johannisthal >
- Chart of year

Chart of year Johannisthal / Tirschenreuther Waldnaab
Discharge from 23.09.2019 to 22.09.2020
- 06.01.1982 Abfluss: 64,1 m³/s
- 06.02.1980 Abfluss: 50,2 m³/s
- 03.01.2003 Abfluss: 49,6 m³/s
- 26.01.1995 Abfluss: 47,6 m³/s
- 02.11.1998 Abfluss: 47,1 m³/s
| Date | Mean value [m³/s] | Maximum [m³/s] | Minimum [m³/s] |
|---|---|---|---|
| 22.09.2020 | 0.536 | 0.546 | 0.493 |
| 21.09.2020 | 0.517 | 0.542 | 0.49 |
| 20.09.2020 | 0.51 | 0.537 | 0.488 |
| 19.09.2020 | 0.49 | 0.536 | 0.483 |
| 18.09.2020 | 0.423 | 0.483 | 0.128 |
| 17.09.2020 | 0.487 | 0.527 | 0.477 |
| 16.09.2020 | 0.481 | 0.524 | 0.473 |
© Bayerisches Landesamt für Umwelt 2024