
- Start >
- Rivers >
- Discharge >
- Naab - Regen >
- Johannisthal >
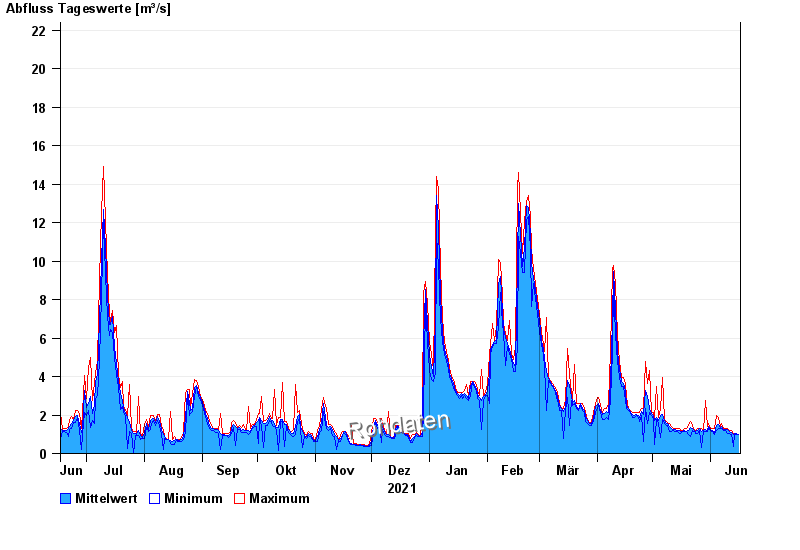
- Chart of year

Chart of year Johannisthal / Tirschenreuther Waldnaab
Discharge from 17.06.2021 to 16.06.2022
- 06.01.1982 Abfluss: 64,1 m³/s
- 06.02.1980 Abfluss: 50,2 m³/s
- 03.01.2003 Abfluss: 49,6 m³/s
- 26.01.1995 Abfluss: 47,6 m³/s
- 02.11.1998 Abfluss: 47,1 m³/s
| Date | Mean value [m³/s] | Maximum [m³/s] | Minimum [m³/s] |
|---|---|---|---|
| 16.06.2022 | 0.97 | 0.97 | 0.97 |
| 15.06.2022 | 1.02 | 1.05 | 0.97 |
| 14.06.2022 | 1.05 | 1.05 | 1.05 |
| 13.06.2022 | 0.976 | 1.05 | 0.344 |
| 12.06.2022 | 1.07 | 1.21 | 0.97 |
| 11.06.2022 | 1.13 | 1.21 | 1.05 |
| 10.06.2022 | 1.24 | 1.29 | 1.05 |
© Bayerisches Landesamt für Umwelt 2024