
- Start >
- Rivers >
- Discharge >
- Naab - Regen >
- Johannisthal >
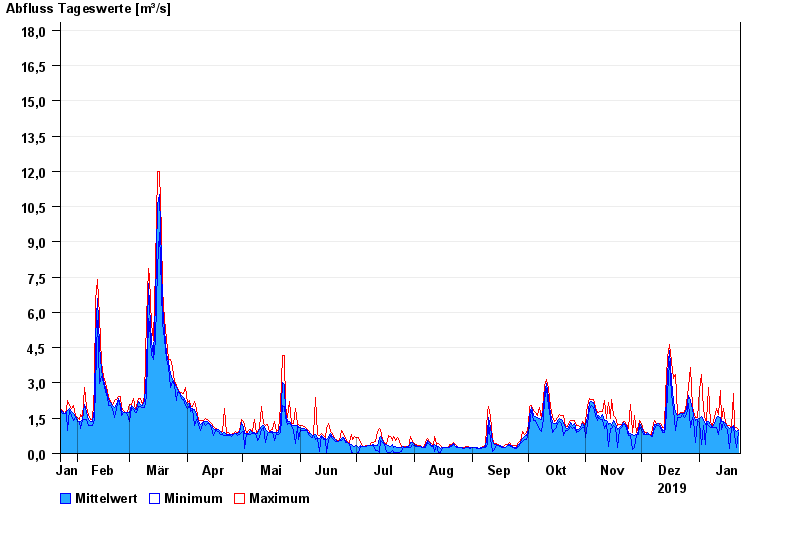
- Chart of year

Chart of year Johannisthal / Tirschenreuther Waldnaab
Discharge from 23.01.2019 to 22.01.2020
- 06.01.1982 Abfluss: 64,1 m³/s
- 06.02.1980 Abfluss: 50,2 m³/s
- 03.01.2003 Abfluss: 49,6 m³/s
- 26.01.1995 Abfluss: 47,6 m³/s
- 02.11.1998 Abfluss: 47,1 m³/s
| Date | Mean value [m³/s] | Maximum [m³/s] | Minimum [m³/s] |
|---|---|---|---|
| 22.01.2020 | 0.991 | 1.01 | 0.912 |
| 21.01.2020 | 0.955 | 1.11 | 0.261 |
| 20.01.2020 | 1.04 | 1.11 | 0.816 |
| 19.01.2020 | 1.19 | 2.55 | 1.11 |
| 18.01.2020 | 1.11 | 1.11 | 1.11 |
| 17.01.2020 | 1.07 | 1.21 | 0.199 |
| 16.01.2020 | 1.13 | 1.21 | 1.01 |
© Bayerisches Landesamt für Umwelt 2024