
- Start >
- Rivers >
- Discharge >
- Naab - Regen >
- Johannisthal >
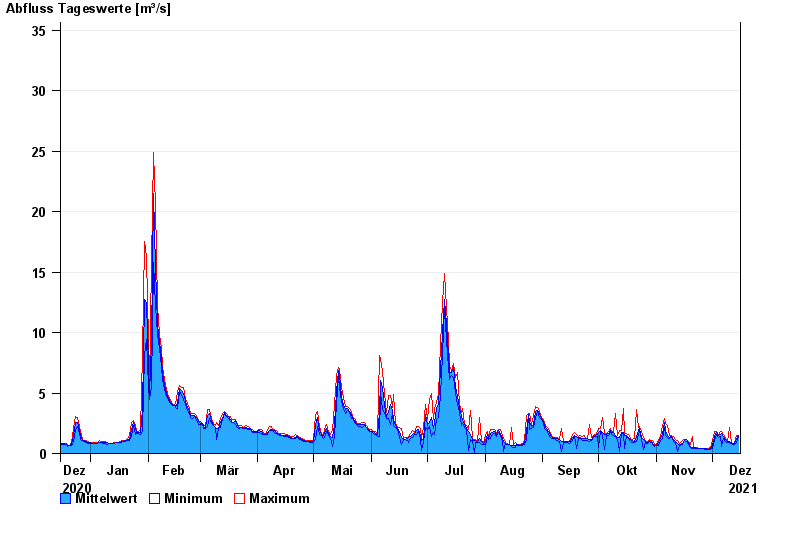
- Chart of year

Chart of year Johannisthal / Tirschenreuther Waldnaab
Discharge from 16.12.2020 to 15.12.2021
- 06.01.1982 Abfluss: 64,1 m³/s
- 06.02.1980 Abfluss: 50,2 m³/s
- 03.01.2003 Abfluss: 49,6 m³/s
- 26.01.1995 Abfluss: 47,6 m³/s
- 02.11.1998 Abfluss: 47,1 m³/s
| Date | Mean value [m³/s] | Maximum [m³/s] | Minimum [m³/s] |
|---|---|---|---|
| 15.12.2021 | 1.45 | 1.47 | 1.38 |
| 14.12.2021 | 1.27 | 1.47 | 0.944 |
| 13.12.2021 | 0.835 | 0.944 | 0.772 |
| 12.12.2021 | 0.811 | 0.838 | 0.772 |
| 11.12.2021 | 0.889 | 0.907 | 0.837 |
| 10.12.2021 | 0.975 | 2.18 | 0.907 |
| 09.12.2021 | 0.973 | 0.981 | 0.907 |
© Bayerisches Landesamt für Umwelt 2024