
- Start >
- Rivers >
- Discharge >
- Naab - Regen >
- Iglersreuth Speicherzufluss >
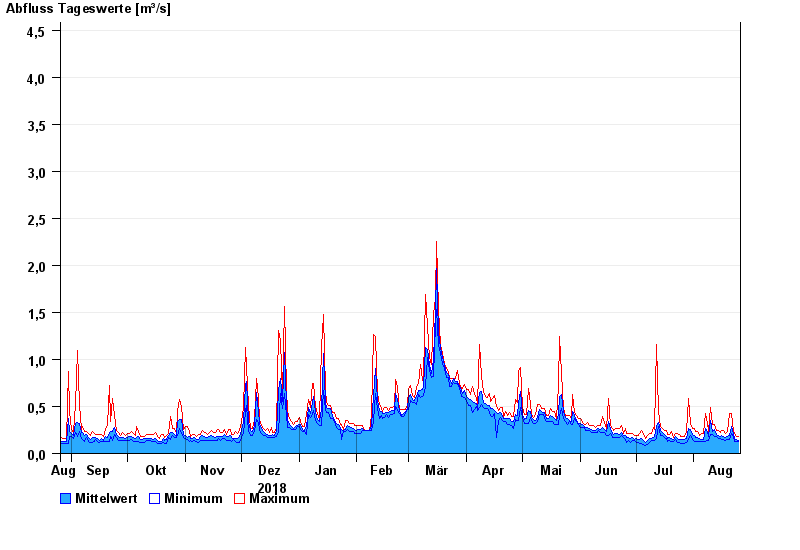
- Chart of year

Chart of year Iglersreuth Speicherzufluss / Tirschenreuther Waldnaab
Discharge from 26.08.2018 to 25.08.2019
- HQ1 5,4 m³/s
- HQ2 6,8 m³/s
- HQ5 10 m³/s
- HQ10 14 m³/s
- HQ20 18 m³/s
- HQ50 26 m³/s
- HQ100 34 m³/s
| Date | Mean value [m³/s] | Maximum [m³/s] | Minimum [m³/s] |
|---|---|---|---|
| 25.08.2019 | 0.142 | 0.182 | 0.126 |
| 24.08.2019 | 0.147 | 0.184 | 0.127 |
| 23.08.2019 | 0.156 | 0.208 | 0.128 |
| 22.08.2019 | 0.202 | 0.233 | 0.165 |
| 21.08.2019 | 0.285 | 0.422 | 0.21 |
| 20.08.2019 | 0.188 | 0.422 | 0.149 |
| 19.08.2019 | 0.18 | 0.238 | 0.15 |
© Bayerisches Landesamt für Umwelt 2024